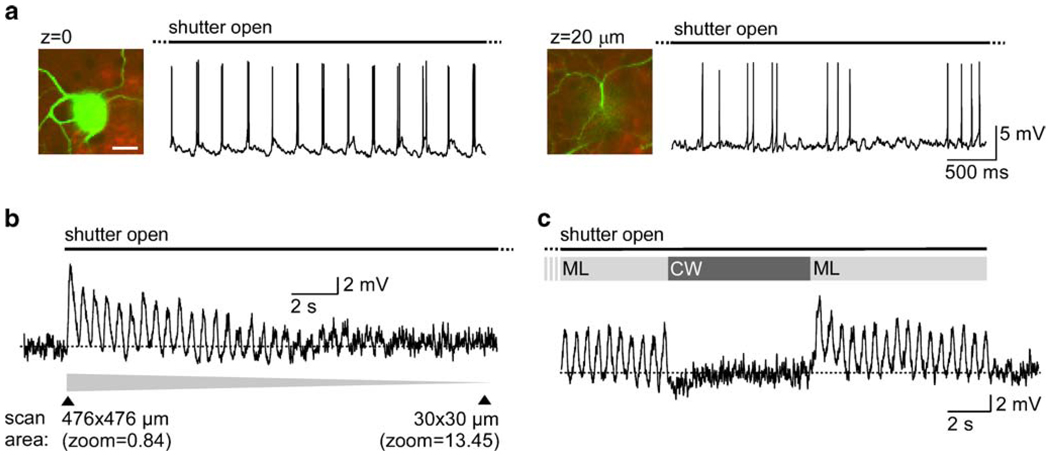
Fig. 8. Laser-evoked responses with fluorescence dye in tissue/recorded cell.
a Voltage response of a direction-selective ON/OFF ganglion cell, which was recorded and filled with OGB-1 via a patch-clamp electrode. The cell spikes periodically to its own somatic fluorescence when the laser scans the soma (left trace). Shifting the focus below the soma eliminated this response (right trace). (images: green OGB-1; red extracellular Sulforhodamine 101; scale bar: 20 µm. Scan area: 84×84 µm, 128×128 pixels/frame, at 2 ms/line; IBkg=53×103 photons·s−1·µm−2). b Voltage response of a starburst amacrine cell (SAC) recorded with a patch-clamp electrode (cell filled with OGB-1) to the laser when continuously decreasing the scan area (bottom gray trace) by changing the zoom factor. Scan area: variable, 128×128 pixels/frame, at 2 ms/line; IBkg=21×103 photons·s−1·µm−2. c Voltage response of a SAC recorded with a patch-clamp electrode (and filled with OGB-1) to switching the laser between mode lock (ML) and continuous wave (CW). Conditions as in b except scan area, which was 168×168 µm. Fluorescent staining: intracellular solution with 100–200 µm OGB-1; extracellular Sulforhodamine 101 largely washed out of tissue except in a (there ~5 µM). Laser: tuned to ~925 nm; mode locked (ML) except in c; power: ~12 mW; focal plane in the IPL (except left trace in a). Stimulator LED: yellow, band-pass-filtered (578 BP 10) background illumination. For more details on recording methods, see [9]

