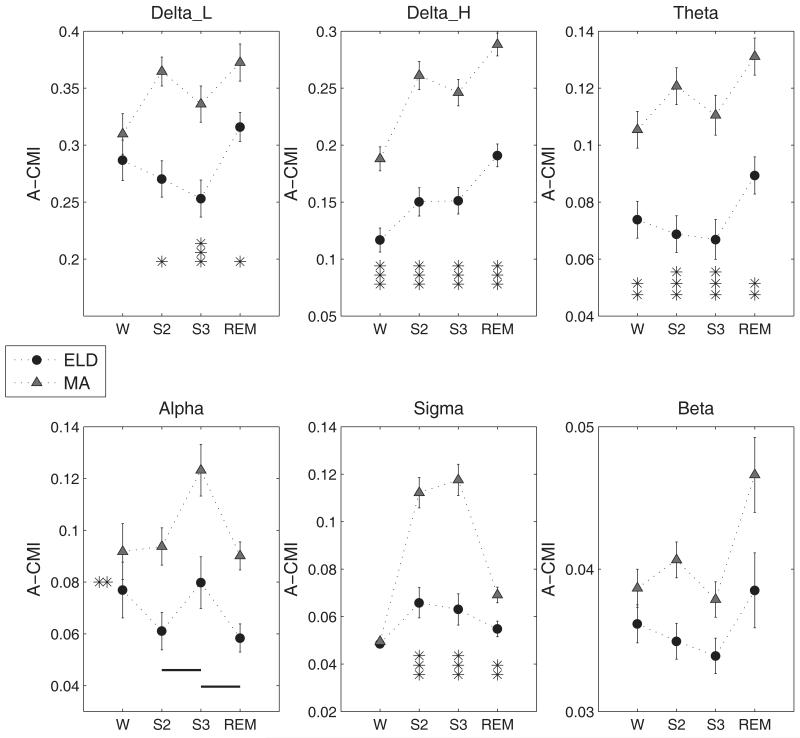
Figure 3.
Average CMI (A-CMI) (Mean ± S.E.) across sleep stages grouped by age for the various spectral bands. Significant differences are marked as, * p<0.05, **p<0.005, ***p<0.0001. In the case of Alpha band, the lines denote the post-hoc results for the STAGE effect when connecting two stages marked along the x-axis. Thick solid line, p<0.0001, thin solid line, p<0.005 and dashed line, p<0.05. Also the significant AGE effect for this band is denoted by the asterisks on the left side inside the plot window.

