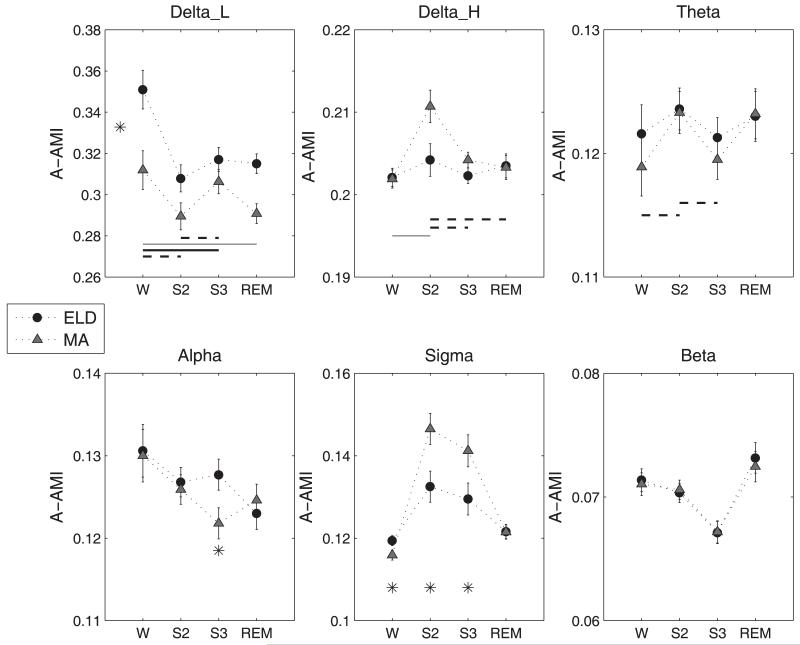
Figure 5.
(Mean ± S.E.) of the A-AMI measure for the spectral bands. The asterisk (p<0.05) denotes significant main effect in AGEGROUP when marked between the A-AMI values corresponding to the two groups (Delta_L band). It denotes significant AGEGROUP*STAGE effect when marked below the A-AMI values at specific sleep stages. The lines denote the post-hoc results for the STAGE effect when connecting two stages marked along the x-axis. Thick solid line, p<0.0001, thin solid line, p<0.005 and dashed line, p<0.05.

