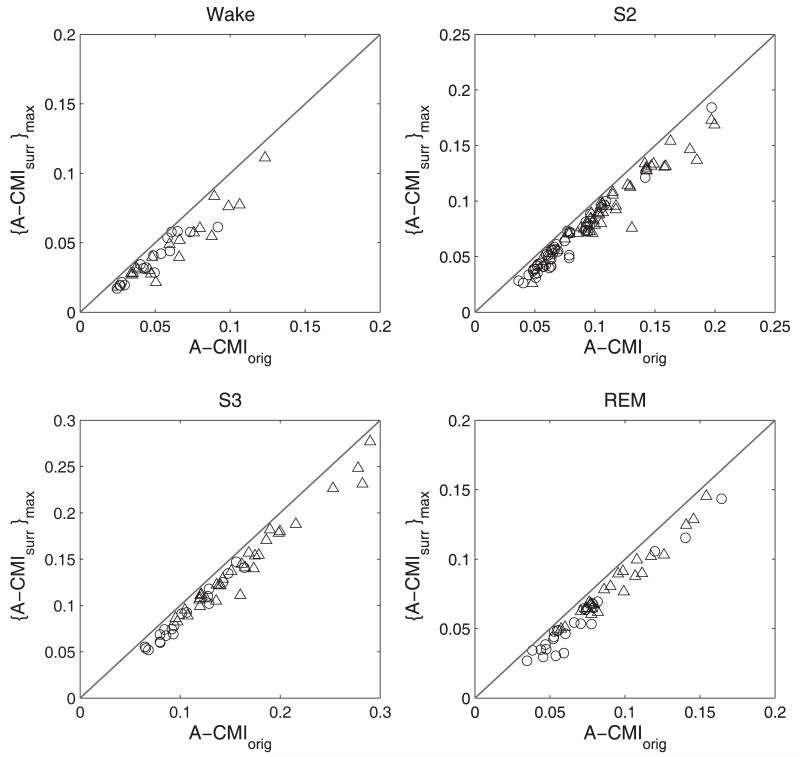
Figure 6.
Results of the surrogate data analysis applied to EEG segments from ELD (circles) and MA (triangles) subjects. The line of identity represents the equality between the average CMI for the EEG segments [A-CMIorig] and the maximum value from the ensemble of the average CMI calculated for the surrogate pairs [{A-CMIsurr}max].

