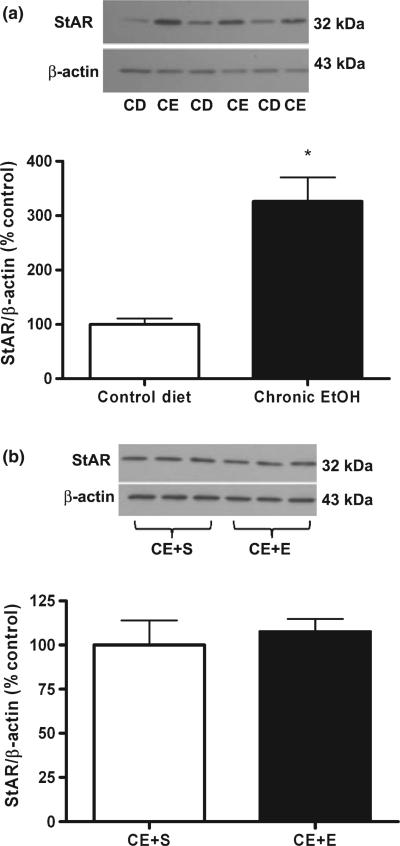
Fig. 3.
Adrenal StAR protein is elevated following chronic ethanol exposure but is not further increased by an ethanol challenge. (a) Adrenal StAR protein expression was measured via western blot analysis in rats exposed to liquid control (CD) and ethanol (CE) diet, normalized to β-actin and presented as % control diet. (b) Adrenal StAR protein expression was also measured in separate groups of rats that were exposed to liquid ethanol diet and subsequently challenged with saline (CE + S) or ethanol (2 g/kg) (CE + E). Results are normalized to β-actin and presented as % CE + S. Representative blots are shown above their respective bar graphs. *p < 0.0001 compared to control diet (Student's t-test), n = 8–12 in duplicate.

