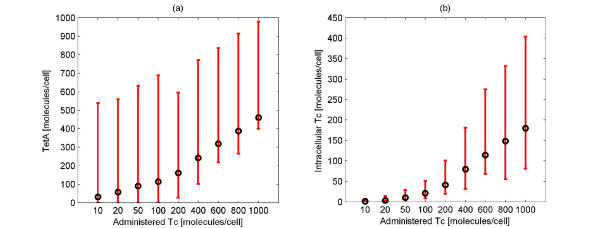
Figure 6.
Maximum average value and variation of the number of intracellular Tc and TetA molecules for different number of administered Tc molecules. Maximum average value (black color) and variation (minimal and maximal values among the population) (red color) of the number of TetA (Figure 6a) and intracellular Tc (Figure 6b) molecules for different number of administered Tc molecules. The variation of both the number of TetA and intracellular Tc molecules is high.

