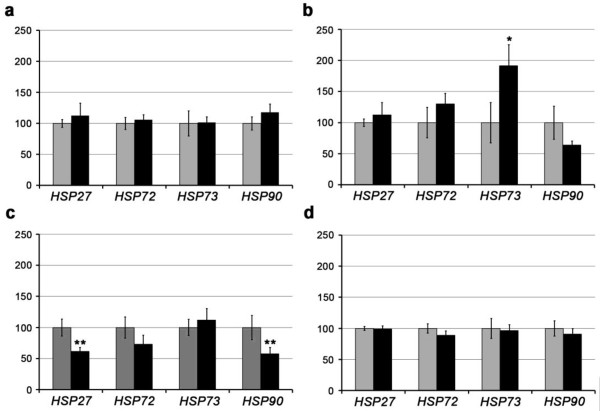
Figure 1.
Gene expression profiles of four chaperone genes (HSP27, HSP72, HSP73, and HSP90) in four CNS areas of control (grey bars) and scrapie (black bars) sheep in the medulla oblongata (a), diencephalon (b), prefrontal cortex (c), and cerebellum (d). Differences between groups were analysed using the Student's t-test (*p < 0.05, **p < 0.01).

