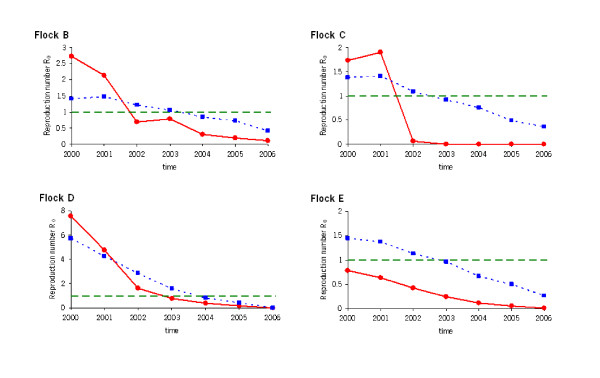
Figure 3.
Change in time of the basic reproduction number R0(t) for flock B-E. Circles represent R0 values calculated using point estimates for the relative susceptibility gγ of different genotypes and age classes. Squares represent R0 values calculated using upper-bound estimates for the relative susceptibility of S/ARR genotypes and lower-bound estimates for the relative susceptibility of S/S genotypes and using an age-independent susceptibility model (α = 1). This combination of parameter choices yields the most conservative prediction of the effect of the breeding programme, i.e. the squares serve as upper confidence bounds when they exceed the results depicted as circles.

