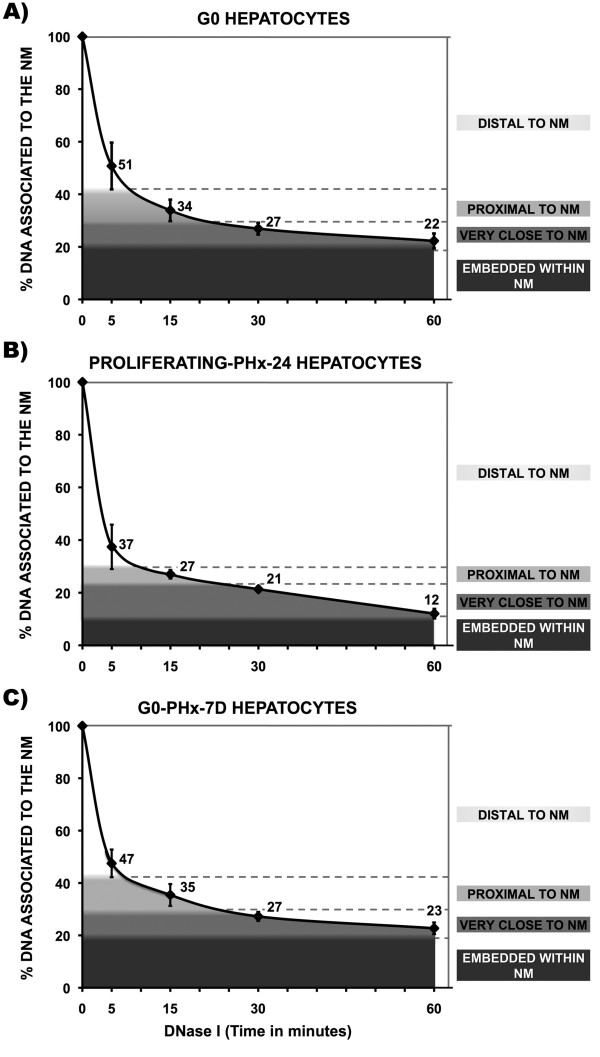
Figure 2.
Kinetics of nucleoid-DNA digestion. Nucleoids from freshly isolated primary rat hepatocytes were digested with a limited concentration of DNAse I (0.5 U/ml) for different times. Each time-point value is the average of separate experiments with samples obtained from separate animals: control G0 hepatocytes (n = 9). Proliferating (PHx-24) hepatocytes 24 h after partial hepatectomy (n = 5). Restored G0 hepatocytes (PHx-7D) 7 days after partial hepatectomy (n = 5). Bars indicate the corresponding S.D. The topological zones relative to the NM (distal, proximal, very close and embedded within the NM) correspond to decreasing percentages of total DNA bound to the NM and were defined according to the corresponding decreasing slopes in each curve. Slopes for control G0 hepatocytes: 0 - 5 min = -9.80; 5 - 15 min = -1.70; 15 - 30 min = - 0.47; 30 - 60 min = -0.17. Slopes for proliferating PHx- 24 hepatocytes: 0 - 5 min = - 12.52; 5 - 15 min = - 1.04; 15 - 30 min = - 0.38; 30 - 60 min = - 0.31. Slopes for G0 PHx-7D hepatocytes: 0 - 5 min = - 10.50; 5 - 15 min = - 1.21; 15 - 30 min = - 0.55; 30 - 60 min = - 0.15.

