
Figure 6.
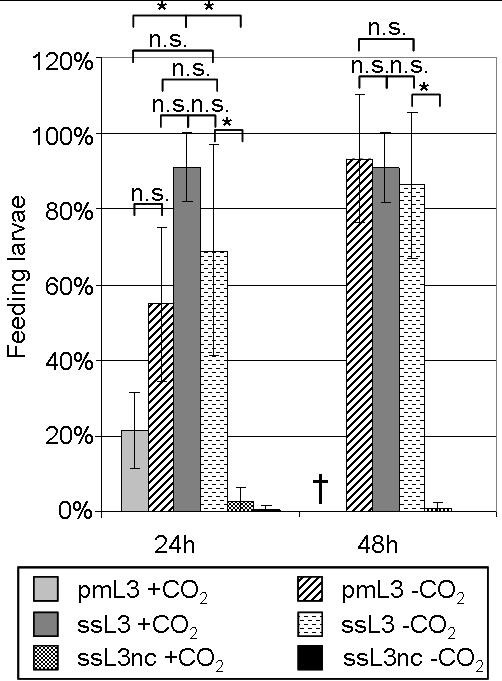
Mean feeding ratio of the different larval populations ± SD (n ≥ 6). Larvae were incubated either in PERL chambers or with or without serum, and with or without CO2 (for detailed overview of populations refer to Table 1). The percentage of feeding larvae was determined after 24 h and 48 h, respectively, using FITC-BSA as described for the serum-stimulation protocol. For each setup, at least 50 live larvae were examined for uptake of FITC-BSA. *: statistically significant difference (p ≤ 0.05); n.s.: not significant; †: no data since most of the larvae died.