Figure 5.
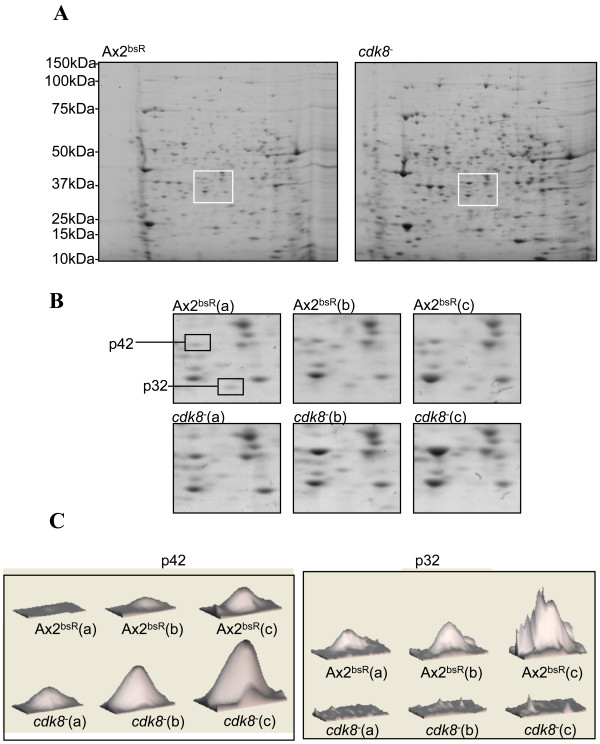
Proteomic Comparison of Ax2bsR and cdk8-2 cells. (A) Aliquots containing 100 μg of soluble protein from whole-cell extracts of growing cells were acetone precipitated and resuspended in 125 μl of sample buffer. The samples were loaded onto nonlinear immobilized pH gradient strips (pH range, 3 to 11; Amersham) before isoelectric focusing on MULTIPHOR II apparatus (Amersham). After equilibration of the strip in equilibration buffer the second dimension was performed by standard gel electrophoresis using a Bis-Tris 8-12% gel. The gels were subsequently stained using colloidal blue (Invitrogen). The squares mark the approximate areas enlarged in B. (B) Enlargement of regions of the Ax2bsR and cdk8-2 gels showing levels of the p42 and p32 proteins. The three paired biological repeats used in later analysis are shown. (C) The Imagemaster 2-DGE Platinum software (Amersham) was used to quantify the intensity of the p42 and p32 protein features as a 3-dimensional graphic. The height of each peak is representative of the intensity of each protein feature. The three biological replicates of each strain are shown.

