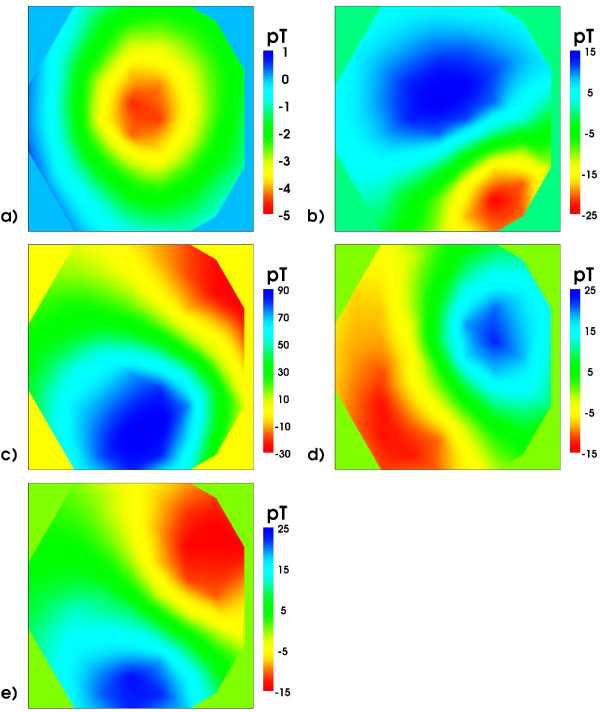
Figure 10.
Magnetic field maps. Magnetic field maps of the z-component of the magnetic induction signal: order a), b), ...e) according to the time instances marked in Figure 9 by green cursors. Note the different scales. The field patterns at the R peak and T maximum are quite similar for this very regular MCG. Pathological cases would behave rather differently.

