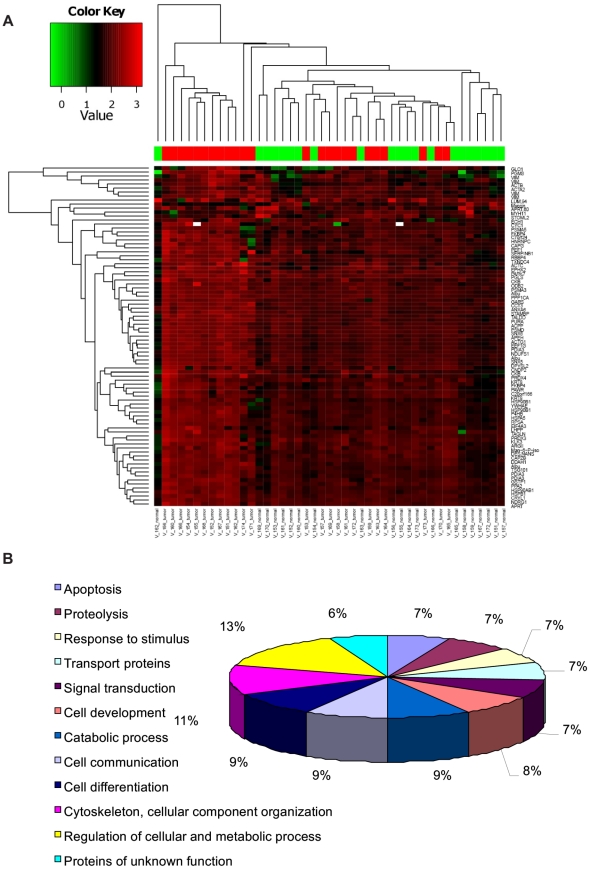
Figure 2. Cluster analysis and Gene Ontology of differential expressed proteins.
(A) Unsupervised clustering (euclidean distance measure and the ‘average’ agglomeration method) was performed using the log transformed expression protein values of 45 samples. The samples are shown horizontally, the proteins vertically. The dendrograms represent the distances between the clusters. In the upper color bar, the tumor samples are marked in red, the normal tissues are shown in green. (B) Biological processes regulated by the all significant differentially expressed proteins assessed by Gene Ontology search and summarized according to their functions.

