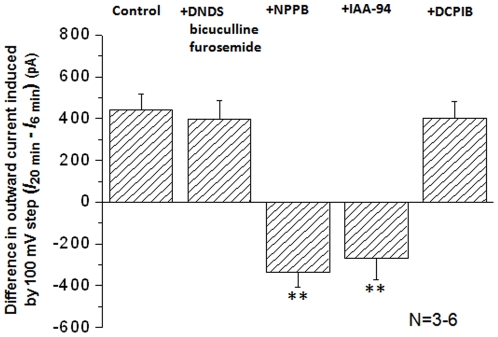
Figure 4. The pharmacology of post-OGD chloride conductance in neurons.
The values in y-axis are the differences of the outward current amplitudes between 6 min and 20 min, I 20 min –I 6 min, in the post-OGD stage. The outward currents were taken from the voltage step at +100 mV. The post-OGD outward chloride currents were not sensitive to the inhibitor cocktail containing DNDS, bicuculline and furosemide and DCPIB, but sensitive to 100 µM NPPB and 300 µM IAA-94. The latter two inhibitors attenuated the outward currents to the level below the current amplitudes measured at 6 min (445±75 pA in control, −334±72 pA in NPPB and −226±106 in IAA-94). ** Indicates a statistical significance of difference between the control and a tested inhibitor at p<0.01.

