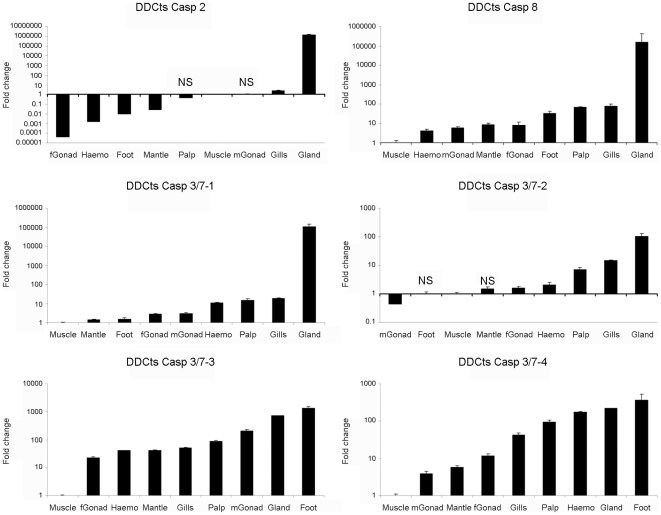
Figure 5. Expression of the six caspase genes in different tissues.
Results represent the mean ± SD of 3 different samples. Fold change units were calculated by dividing the normalized expression values in the different tissues by the normalized expression values obtained in the muscle. Data were analyzed using the Student’s t-test. NS: no significant differences regarding to the expression levels detected in the muscle.

