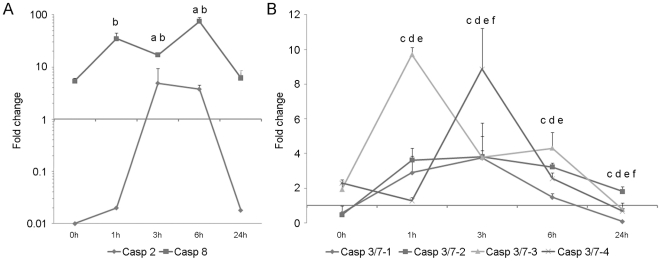
Figure 8. Kinetics of caspase gene expression in hemocytes treated with UV light.
Results represent the mean ± SD of 3 pools (3 hemocyte populations per pool). Data were analyzed using the Student’s t-test. A: Evolution of the expression levels of initiator caspase-2 and caspase-8. a and b indicate significant differences in caspase-2 and -8, respectively. B: Evolution of the expression levels of executioner caspase-3/7-1, -3/7-2, -3/7-3 and -3/7-4. c, d, e and f indicate significant differences (p<0.05) in caspase-3/7-1, -2, -3 and -4, respectively.

