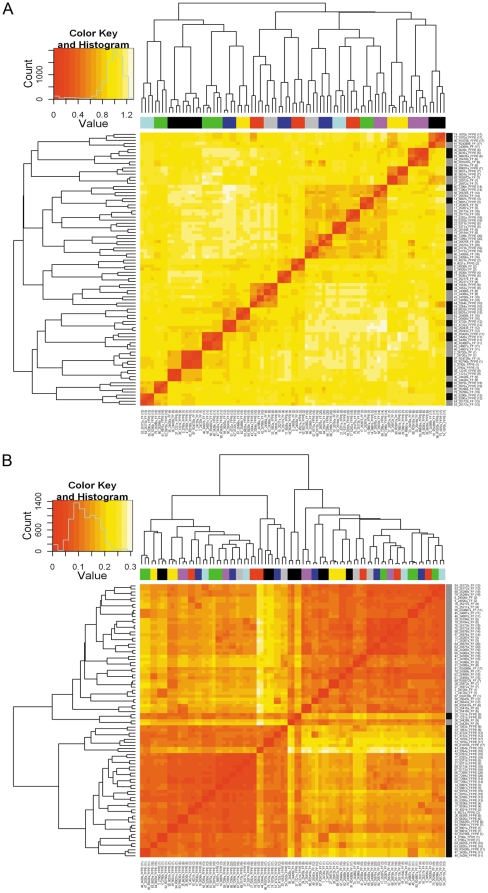
Figure 2. Heat maps of the distance matrix representing the pairwise distances between all FFPE and FF samples (n = 89) using all probes that passed the p-value filter (n = 21178).
Prior to the computation of the distance matrix (where distance = 1-Pearson correlation), data were normalized with a simple scaling normalization without background correction and then median centered per probe, separately for FFPE and FF samples. The paired samples are indicated with a number from 1 to 20 and are color coded. The tissue type is indicated with the vertical bar (black = FFPE, white = FF). (A) Heat map using median centered log2 normalized data. (B) Heat map using non-median centered log2 normalized data.

