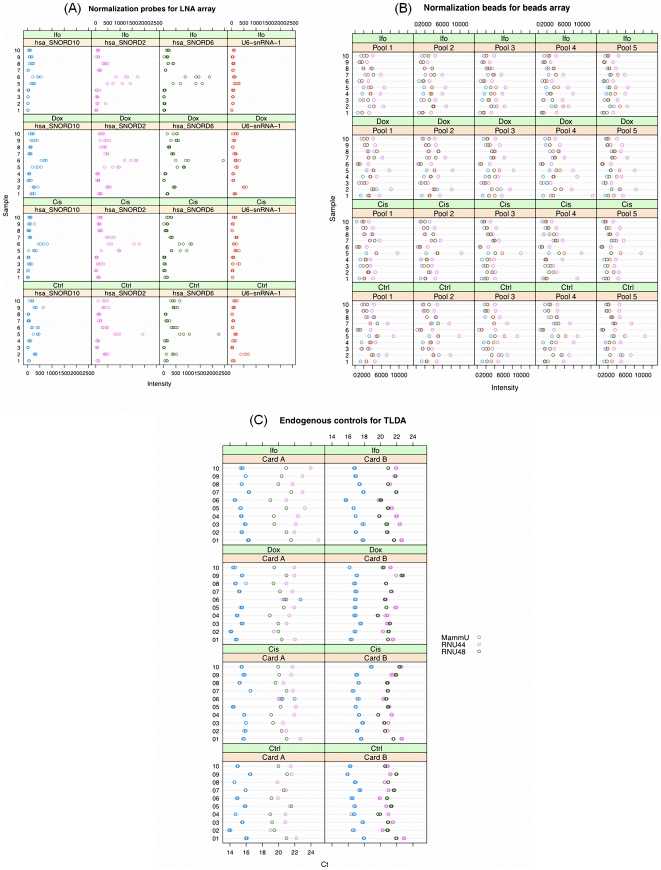
Figure 4. Comparison of three platforms' miRNA profiling data.
(A) LNA array: The expressions of the four normalization probes in each LNA array are plotted, which have similar patterns across 10 samples under the four different treatments. (B) Beads array: The expressions of the four normalization beads in the five pools while testing 40 different samples are compared, which have similar patterns in the five pools across samples and indicate that these transcripts do not express significant variation between pools and samples. (C) TLDA: The profiles of the three endogenous controls commonly used by TLDA Cards A and B are demonstrated relatively stable across samples and treatments. Ctrl, Cis, Dox, and Ifo represent control, and three different chemo drug treatments.

