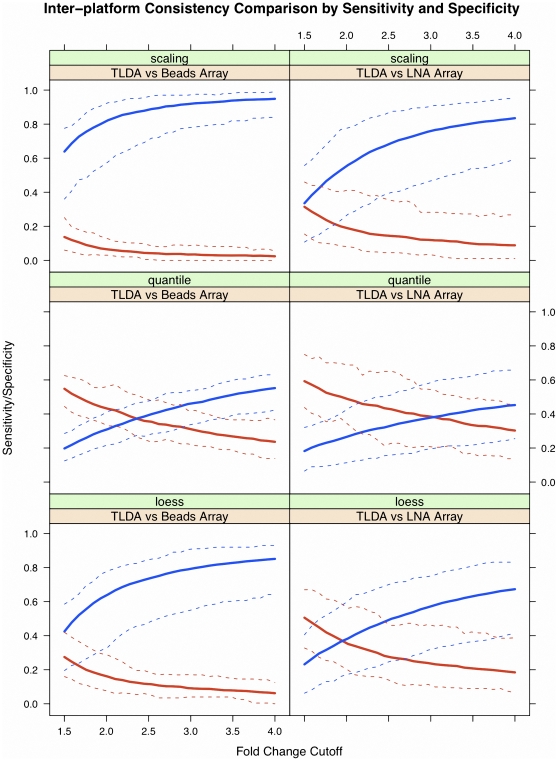
Figure 6. Inter-platform reproducibility measured by sensitivity and specificity.
Sensitivities were compared to evaluate the consistency among the three platforms. The three plots in the first column compare the consistency between beads array and TLDA, the three plots in the second column compare the consistency between LNA array and TLDA, and the plots in the third column compare the consistency between beads array and LNA array. The results in the first, second and third rows are based on the profiles normalized using scaling by specific controls/probes, quantile normalization, and the cyclic loess method, respectively.

