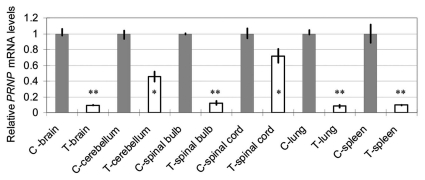
Figure 4.
Relative bPRNP mRNA levels (PRNP/GAPD) in several organs of the transgenic calf as revealed by qRT-PCR. Gray columns show the control levels expressed as unity. Blank columns show those of the transgenic calf. Bars show the standard deviation of the mean. Asterisks denote a statistically significant difference from the control at less than a 5% (*) or 1% (**) level.

