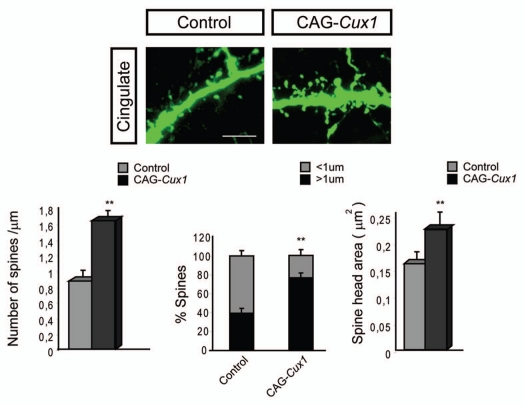
Figure 2.
Dendritic spine formation in neurons of the cingulate cortex is stimulated upon Cux1 overexpression. Upper parts show representative confocal image of GFP positive spines in the cingulate cortex. These neurons had been electroporated with control or CAG-Cux1 plasmid. Scale bar represents 5 um. Lower parts show quantification of dendritic spine number, spine morphology and spine head area. Data in bar graphs depict mean ± SD. *p < 0.005, **p < 0.001, compared with control. This figure is a modification of Cubelos et al.15

