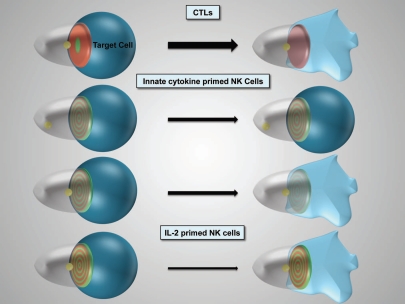
Figure 1.
Schematic representation of cytolytic effector polarization. The progression of the different cytolytic effector/target cell couples as indicated from initial polarization within seconds of tight cell coupling (left) to sustained polarization over several minutes (right) is depicted. The thickness of the arrow indicates efficacy of progression. For innate cytokine-primed NK cells two distinct cell couples fates exist. The target cell is in blue, loss of color and shape denotes lysis. The cytolytic effector is transparent. The position of the MTOC is given in yellow, interface accumulation with its spatiotemporal patterning of actin and active Cdc42 in red and green, respectively. Color intensity indicates extent of accumulation.

