Figure 1.
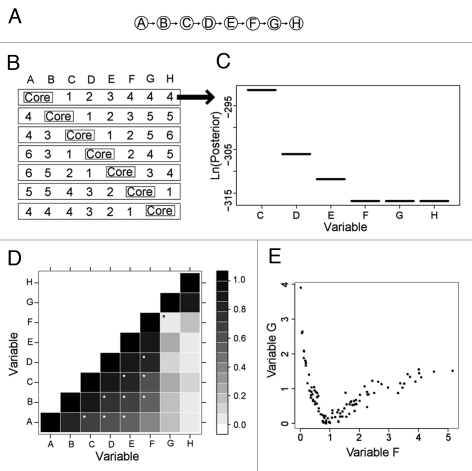
Synthetic network and corresponding BN+1 results for two-variable core expansion. (A) A synthetic eight-variable network. (B) Seven distinct core networks composed of two adjacent variables were used for BN+1 expansion analysis. In each row, integers represent the ranks of the BN+1 variables (where 1 = top scoring gene, etc.,). (C) The posterior score distribution of BN+1 variables identified in the first row of (A). (D) Plot of absolute values of pair-wise Pearson correlations for all variables. The black star denotes a relationship (between F and G) that has a poor Pearson correlation (coefficient = 0.056). White stars denote good relations between variables with correlation coefficient ≥0.5 and separated by at least one variable in the synthetic network (A). (E) A nonlinear relationship between variables F and G.

