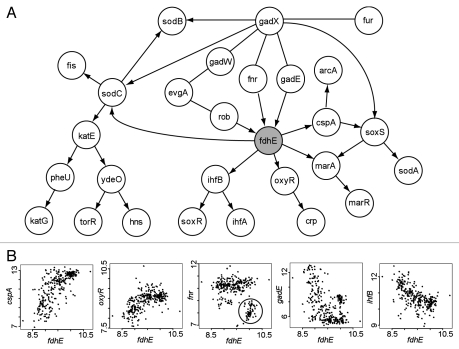
Figure 2.
Analysis of the potential RO S gene fdhE predicted by BN+1. (A) Consensus Bayesian network generated from 13 networks sharing the same top log posterior score. (B) Selected relationships between fdhE and its associated genes. Nonlinear relationships were often observed. The ellipse in the fnr-fdhE plot highlights a group of fnr-fdhE associations that are discussed in the text.

