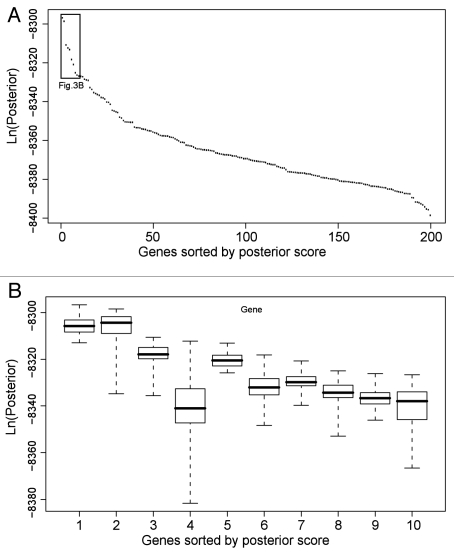
Figure 3.
Analysis of top BN+1 genes in the RO S use case. (A) Generic plot of best score for top 200 BN+1 genes. (B) Variation in scores for top 10 genes. The BN+1 genes are ranked by maximum scores of all networks containing the core genes plus one additional gene. Genes sorted by posterior scores are shown in horizontal axis. Box plots for the set of scores pertaining to each gene are displayed. The variations are calculated based on various simulations in different computers. To perform each simulation, a simulated annealing approach was used with an unfixed structural prior (i.e., the core network edges) with multiple replicates and moderate simulation time to allow a comprehensive though non-exhaustive search.

