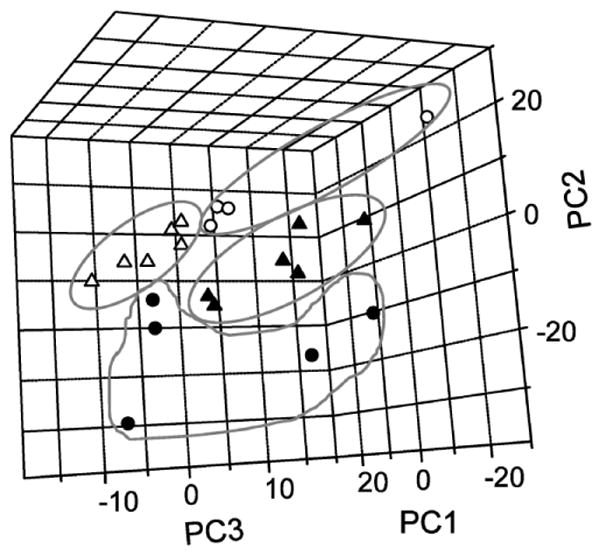
Figure 3.

Principal component analysis (PCA) of mitochondrial protein electropherograms. Score plot of PCA-analyzed samples using the first three PCs (filled triangle, young fast-twitch, filled circle, old fast-twitch; open triangle, young slow-twitch; open circle, old slow-twitch). A series of two-dimensional panels of the score plot are shown in Supplemental Figure 3.
