Abstract
We studied the fluorescence properties of several potential picosecond lifetime standards suitable for two-photon excitation from a Ti : sapphire femtosecond laser. The fluorescence emission of the selected fluorophores (rose bengal, pyridine 1, and LDS 798) covered the visible to near-infrared wavelength range from 550 to 850 nm. We suggest that these compounds can be used to measure the appropriate instrument response functions needed for accurate deconvolution of fluorescence lifetime data. Lifetime measurements with multiphoton excitation that use scatterers as a reference may fail to properly resolve fluorescence intensity decays. This is because of the different sensitivities of photodetectors in different spectral regions. Also, detectors often lose sensitivity in the near-infrared region. We demonstrate that the proposed references allow a proper reconvolution of measured lifetimes. We believe that picosecond lifetime standards for two-photon excitation will find broad applications in multiphoton spectroscopy and in fluorescence lifetime imaging microscopy (FLIM).
Index Headings: Instrument response function, IRF, Two-photon excitation, Lifetime standards, Fluorescence lifetime imaging microscopy, FLIM
INTRODUCTION
Time-resolved fluorescence measurements require knowledge of the instrument response function (IRF) in order to deconvolute the decay parameters. In two-photon excitation (TPE) fluorescence spectroscopy there are four major difficulties that can affect the IRF. If using scattering of the excitation light, which is the most convenient way to record the IRF, the calibration may fail because of (1) sensitivity of the detector; (2) nonlinearity of the TPE in comparison to the Rayleigh scattering process, which inherently causes scatterers to be improper for determination of IRF; (3) the microscopy set up: necessary realignment in order to remove the laser-blocking dichroic beam splitter; and (4) the color effect. Two-photon spectroscopy usually uses infrared (IR) light for excitation, so photon detection in this wavelength region is a major problem for almost all standard detectors (photomultiplier tubes (PMTs), avalanche photodiodes (APDs), and charge-coupled devices (CCDs)). Detection of IR light with PMTs largely causes emission of electrons not from the cathode but from the first dynode. This process may limit the use of scatterers as IRFs. The color effect for high-speed detectors, such as micro-channel plate photomultipliers (MCP-PMT) or streak cameras, is practically nonexistent. For these detectors, it is usually sufficient to simply replace the sample with a scattering medium and record it as the IRF. However, for the most popular detectors used in spectroscopy/microscopy—PMTs and APDs—the different colors of the reference and fluorescence emission1–3 may cause a significant distortion in the reconvoluted lifetime. The idea of using reference fluorophores to avoid color effects is not a new one. Several research groups have already proposed a number of useful fluorophores to serve this purpose4–6 in one-photon excitation spectroscopy. Recently, we also described a few reference fluorophores with short lifetimes emitting in the visible and near-infrared (NIR) region7–9 for one-photon spectroscopy.
The development of TPE has mostly been spurred by biological applications10–12 to molecule detection at levels not reached by conventional (one-photon) excitation. The usefulness of TPE arises from its different selection rules for absorption, higher values for anisotropy, and usually much smaller and more easily controllable confocal microscope volume. In the case of TPE, however, there could be a large difference between the excitation and emission wavelengths, and the need for reliable reference fluorophores is even more demanding than in single-photon spectroscopy/microscopy. According to our knowledge there are only a few reports on lifetime reference compounds for TPE13–16 that rely on detection of hyper Rayleigh scattering (HRS) and second-harmonic generation (SHG). The advantage of using HRS and SHG in the lifetime deconvolution of the fluorescence of typical fluorophores has been shown in examples. We propose here an alternative method that addresses the potential pitfalls mentioned above; the method relies on recording the IRF in the close spectral region of emission of the studied fluorophores.
In this manuscript, we report a study on TPE reference standards for time-resolved spectroscopy/microscopy whose fluorescence emissions cover the visible to NIR spectral region. These fluorophores can be used to determine the IRF in lifetime measurements using TPE as well as for evaluation of detectors used in TPE spectroscopy/microscopy.
MATERIALS AND METHODS
4-Dicyanomethylene-2-methyl-6-p-dimethylamino-styryl-4H-pyran (DCM), 1-ethyl-2-(4-(p-dimethylaminophenyl)-1,3-butadienyl)-quinolinium perchlorate (LDS 798), and 1-ethyl-4-(4-(p-dimethylaminophenyl)-1,3-butadienyl)-pyridinium perchlorate (Py1) were purchased from Exciton, Inc. and used as received. Rhodamine 800 (Rh800) was from Lambda Physik (Fort Lauderdale, FL); spectral grade (99.9%) ethanol (EtOH) and methanol (MeOH) were from Sigma Aldrich and also used as received.
Absorption and emission spectra were obtained using Cary 50 Bio and Cary Eclipse (Varian, Inc.) spectrophotometers. The steady-state quantum yields (QY) of all fluorophores used were determined using cresyl violet (QY = 0.54 in MeOH) as a reference. LDS 798, Py1, and cresyl violet were excited at the same wavelength (600 nm) and recorded with identical equipment parameters. Calculations were performed using extinction coefficients of 4.55 × 10⁴ M−1 cm−1 (LDS 798), 3.8 × 10⁴ M−1 cm−1 (Py1), and 1.06 × 10⁵ M−1 cm−1 (cresyl violet).
Intensity decays were measured in the time-domain using an FT200 (Picoquant, GmbH) equipped with MCP-PMT (Hamamatsu, Inc.) detector. Data were collected and processed using the PicoHarp300 time-correlated single-photon counting (TCSPC) module17 based on detection of single photons. A polarizer, monochromator, and proper combination of filters were placed in the detection path. In order to reject the scattered excitation light we used two 750 nm short wave pass filters in front of the monochromator. For all the measurements the excitation was obtained using a Ti : sapphire laser with a repetition rate of 80 MHz. Data analysis was performed using FluoFit software (v. 4.2.1, PicoQuant GmbH) to reconvolute the fluorescence decays on a sum of exponentials:
| (1) |
where αi and τi are pre-exponential factors and fluorescence lifetimes.
Two-photon fluorescence cross-sections were estimated by comparing two-photon-induced fluorescence of the dyes used with that of rhodamine B (RhB) in methanol. After detection of the two-photon fluorescence signal (I), the cuvette with the solution under study was replaced with a similar reference without changing the excitation and detection geometry. The two-photon cross-section σ was calculated by comparison with the cross-section of the reference (σ0), rhodamine B (RhB, σ0 = 170 GM for 810 nm),18 using the formula
| (2) |
where I0 is the two-photon fluorescence signal of the reference, C and C0 are the molar concentrations of the sample and reference, respectively, and Φ andΦ0 are their quantum yields.
The quadratic dependence of the fluorescence intensity on the excitation intensity was verified for each sample, indicating that the measurements were carried out in intensity regimes in which saturation or photo-degradation did not occur.
RESULTS AND DISCUSSION
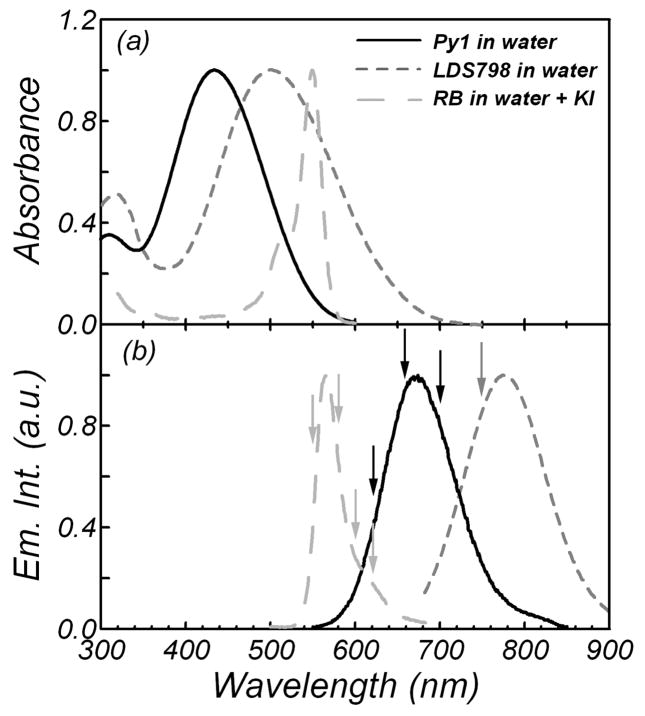
The one-photon absorption (Fig. 1a) and emission (Fig. 1b) spectra of dyes as potential IRFs are presented in Fig. 1. Their characteristics are summarized in Table I together with the values of the TPE cross-sections for 810 nm excitation. Colors and appearance presented in Fig. 1a correspond to the colors and appearance of emission curves presented in Fig. 1b. As can be seen (Fig. 1b), the emissions of the dyes used for two-photon excitation cover the part of the spectra (550–850 nm) that is popularly recognized as a high signal-to-noise ratio region for detectors. Fluorescence signals of the dyes were measured at wavelengths indicated by the arrows in Fig 1b.
Fig. 1.
(a) Absorption and (b) emission spectra of pyridine 1 (solid line), LDS 798 (dotted line) and rose bengal (dashed line) in water. Rose bengal solution contained 5 M potassium iodide. Arrows indicate the observation wavelengths.
TABLE I.
Photophysical data of chromophores used as references for two-photon excitation experiments. Cross-sections were calculated relative to RhB.
| Compound | λmax [nm]a | λmax [nm]b | Φc | σ [GM]d |
|---|---|---|---|---|
| RB+KI in H2O | 550 | 570 | 0.003 | 50 |
| Py1 in H2O | 430 | 670 | 0.03 | 0.35 |
| LDS 798 in H2O | 500 | 780 | 0.002 | 2.4 |
One-photon absorption maxima.
One-photon emission maxima.
Fluorescence quantum yields determined relative to cresyl violet in MeOH.
Cross-sections calculated for 810 nm in GM (10−50 cm4·s·photon−1) with relative error ±20%.
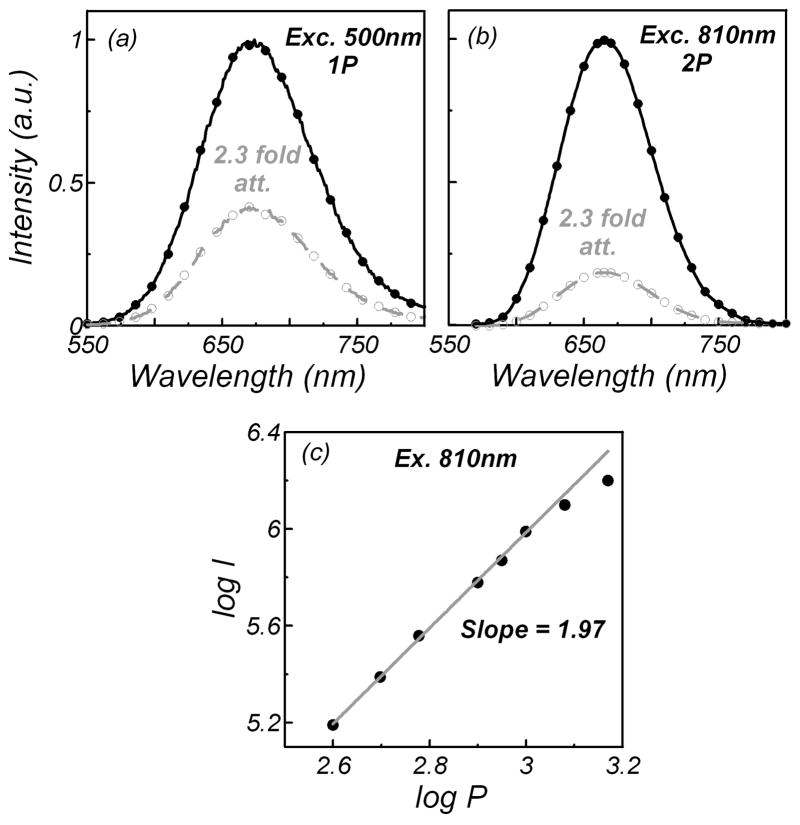
The two-photon nature of excitation is usually proved by studying the dependence of its fluorescence intensity on the excitation power. Figure 2 presents the results of such a study for Py1 in MeOH excited in both the one- and two-photon modes at 500 nm and 810 nm, respectively. As can be seen, the emission spectra show a similar shape for one-photon (Fig. 2a) and two-photon (Fig. 2b) excitation processes. Next, we attenuated the excitation with a 0.4 neutral density filter, which reduced the excitation power by 2.3 fold (Figs. 2a and 2b, dashed lines). The attenuation of the excitation power proportionally reduced the one-photon-induced fluorescence by about 2.3 fold and the two-photon-induced fluorescence by about 5.3 fold. A more detailed study of the two-photon-induced fluorescence of pyridine 1 as a function of the excitation power is shown in Fig. 2c, which clearly indicates the two-photon process. We observed similar dependencies for other references studied, rose bengal (RB) and LDS 798.
Fig. 2.
Emission spectra of pyridine 1 in MeOH measured with (a) one- and (b) two-photon excitation. Dashed lines represent the emission spectra with 2.3-fold attenuation of the excitation power. (c) Log–log plot of the two-photon-induced fluorescence intensity (I) versus different excitation laser powers (P) (fit calculation performed for 0.4–0.8 W laser power with regression coefficient equal to 0.9986).
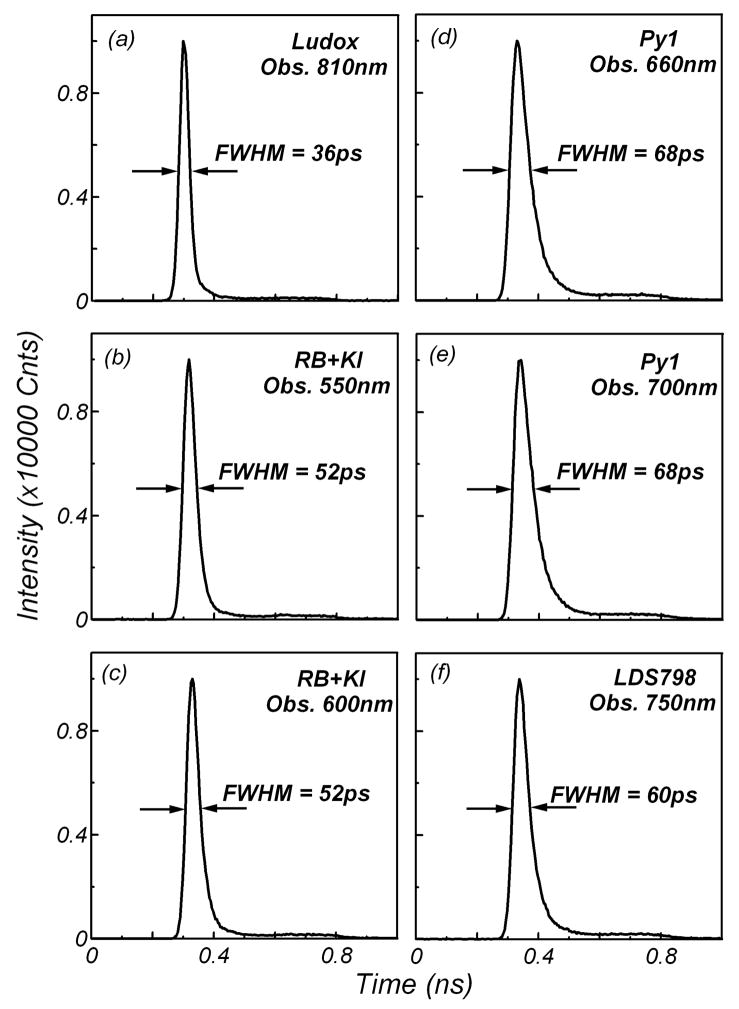
Figure 3 presents the time responses of the silica scatterer Ludox and the proposed lifetime standards measured using the MCP-PMT detector. Excitation was at 810 nm from a Ti : sapphire laser (80 MHz repetition rate, 100 fs pulses) and the observation was at various wavelengths, from 550 nm to 810 nm. All responses are very short, with full widths at half-maximum (FWHM) below 70 ps. The shortest FWHM of the IRF reported in the literature for the scatterer is 32 ps,19 which corresponds well with the observations of our experiment (36 ps, Fig. 3a). The time responses of fluorophores are broader and depend on the lifetime of the dye. The relatively short lifetimes make those compounds attractive as IRF standards, allowing color-effect-free measurements in the emission region of the studied specimens.
Fig. 3.
Temporal profiles of (a) scattered 810 nm excitation light, and two-photon-induced fluorescence of: rose bengal + 5 M KI observed at (b) 550 nm and (c) 600 nm; pyridine 1 observed at (d) 600 nm and (e) 700 nm; and (f) LDS 798 observed at 750 nm. Responses were measured using the ultra-fast-detector MCP-PMT.
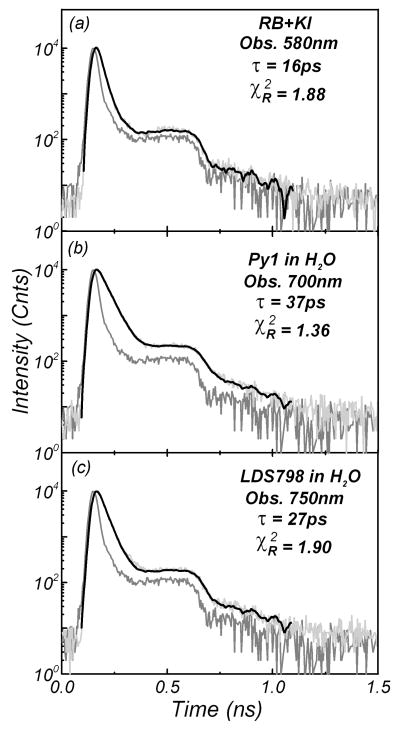
We measured the lifetimes of the proposed standards for time-resolved two-photon-induced fluorescence using the same scatterer (Ludox) as the IRF. Figure 4 presents time-domain measurements for RB, Py1, and LDS 798 observed at 580 nm, 700 nm, and 750 nm, respectively. The fluorescence decays of all the molecules were fitted with a single exponential model with lifetimes of 16 ps for RB, 27 ps for LDS 798, and 37 ps for Py1. We measured the lifetimes of these compounds for various observation wavelengths, from 550 nm to 750 nm. Good fits to the decays were found, with small values of . All the results are summarized in Table II.
Fig. 4.
Two-photon-induced fluorescence intensity decays of: (a) rose bengal in the presence of 5 M KI, (b) pyridine 1 in water, and (c) LDS 798 in water. The instrument response function was obtained from a Ludox scatterer (red). The recovered lifetimes are: 16 ps for rose bengal, 37 ps for pyridine 1, and 27 ps for LDS 798. The excitation (810 nm) was from a femtosecond Ti : sapphire laser.
TABLE II.
The measured lifetimes of recommended picosecond lifetime standards in two-photon excitation.a
| Compound | Obs. [nm] | IRF | α | τ (ps) | ||
|---|---|---|---|---|---|---|
| RB+KI in H2O | 550 | Ludox | 1 | 14 | 2.0 | |
| RB+KI in H2O | 580 | Ludox | 1 | 16 | 1.9 | |
| RB+KI in H2O | 600 | Ludox | 1 | 17 | 1.4 | |
| RB+KI in H2O | 620 | Ludox | 1 | 17 | 1.9 | |
| Py1 in H2O | 620 | Ludox | 1 | 36 | 1.2 | |
| Py1 in H2O | 660 | Ludox | 1 | 36 | 1.6 | |
| Py1 in H2O | 700 | Ludox | 1 | 37 | 1.4 | |
| LDS 798 in H2O | 750 | Ludox | 1 | 27 | 1.9 |
The samples were excited at 810 nm.
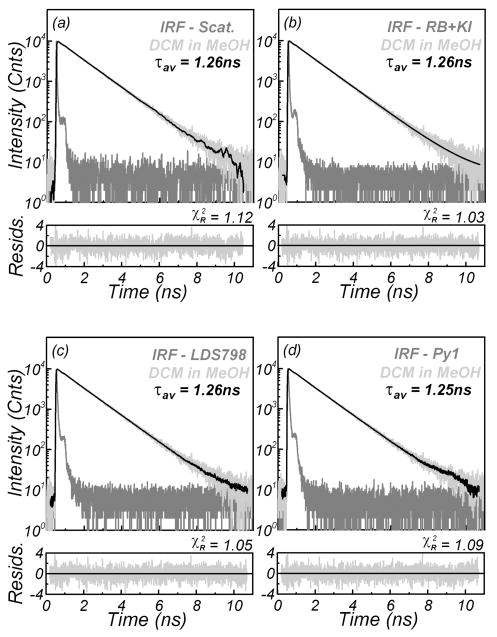
The resolution of decays on the order of a few or tens of nanoseconds using picoseconds standards is easy and intuitively obvious. The question arises of whether subnanosecond decays can be reasonably resolved using the proposed references. We selected fluorophores with subnanosecond lifetimes and measured their intensity decays with both the scatterer and the reference IRFs. The recovered decay parameters are presented in Table III. There are only minimal differences in the lifetimes of the references and the scatterer. As an example, we present time-domain lifetime measurements of the same sample of DCM in methanol resolved with the scatterer and the proposed references (Fig. 5). The reconvolution resulted in the same lifetime, independent of IRF.
TABLE III.
Subnanosecond/nanosecond intensity decays of dyes with two-photon excitation measured versus different IRFs.
| Compound | Obs. [nm] | IRF | α1 | τ1 [ps] | α2 | τ2 [ps] | τ̄[ps]a | ||
|---|---|---|---|---|---|---|---|---|---|
| RB in MeOH | 580 | Ludox | 1 | 516 | - | - | 516 | 2.2 | |
| RB in MeOH | 580 | RB+KI | 1 | 510 | - | - | 510 | 2.3 | |
| DCM in MeOH | 620 | Ludox | 0.82 | 1299 | 0.18 | 225 | 1264 | 1.1 | |
| DCM in MeOH | 620 | RB+KI | 0.82 | 1291 | 0.18 | 194 | 1259 | 1.0 | |
| DCM in MeOH | 620 | LDS 798 in H2O | 0.82 | 1292 | 0.18 | 197 | 1256 | 1.1 | |
| DCM in MeOH | 620 | Py1 in H2O | 0.84 | 1277 | 0.16 | 179 | 1248 | 1.1 | |
| LDS 798 in EtOH | 750 | Ludox | 1 | 152 | - | - | 152 | 2.4 | |
| LDS 798 in EtOH | 750 | LDS 798 in H2O | 1 | 148 | - | - | 148 | 1.3 |
The samples were excited at 810 nm.
.
Fig. 5.
Two-photon-induced fluorescence intensity decay of DCM in MeOH reconvoluted versus: (a) scatterer (Ludox), and using ultra-short fluorescence standards: (b) quenched rose bengal, (c) LDS 798 in water, and (d) pyridine 1 in water. The excitation was from a Ti : sapphire laser (810 nm, 80 MHz repetition rate).
We believe that one can use either the scatterer or the proposed reference if detection is carried out with a micro-channel plate photomultiplier. In the case of photodiodes or photomultipliers, however, the reference standards offer detection at the same wavelengths as the emissions of the studied fluorophores. Also, these detectors are more sensitive in the fluorescence region than in the NIR region.
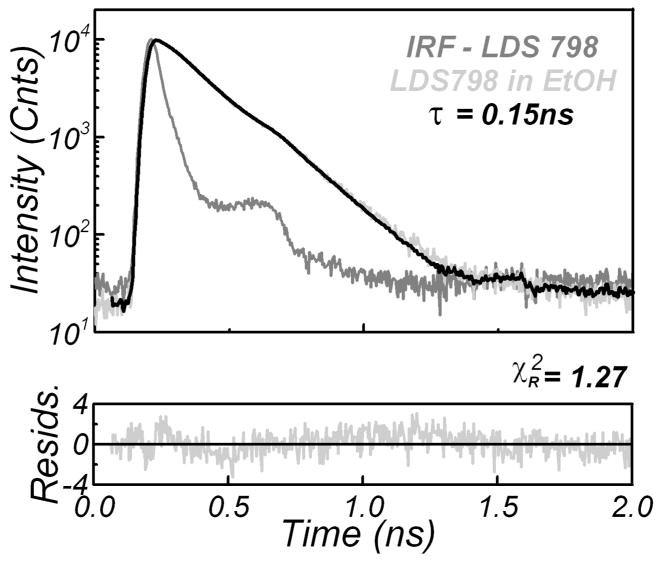
Finally, we present the subnanosecond lifetime measurements in the NIR region. The two-photon-induced fluorescence intensity decay of LDS 798 in ethanol is presented in Fig. 6. The reconvolution of the decay with the IRF obtained from LDS 798 in water resulted in a lifetime of 148 ps, just 4 ps shorter than that recovered using the scatterer (Table III).
Fig. 6.
Two-photon-induced fluorescence intensity decay of LDS 798 in ethanol. A solution of LDS 798 in water was used for the IRF.
CONCLUSION
We believe that the proposed picosecond lifetime reference standards will accurately deconvolute decays in two-photon-induced time-resolved fluorescence measurements. The advantage of fluorescence references over scattering is evident because decay measurements can be deconvoluted with the function obtained for the same wavelength as the fluorescence of the specimen (in the two-photon processes the observation is at a shorter wavelength than the excitation). These references are extremely easy to prepare. Their fluorescence properties cover extended regions of the excitation and emission wavelengths with APD detectors, especially when the observation is at much longer wavelength than the excitation. The use of scatterers as IRFs may introduce artificial components in the reconvoluted decay because of a wavelength-dependent photodetector time response. This is extremely important in fluorescence lifetime imaging microscopy measurements, in which artificial changes of the measured lifetime can distort the lifetime map or picture.
Acknowledgments
This work was supported by Texas ETF (CCFT, Z.G.) and NIH R21CA149897 (Z.G.) and R41EB008614-01A1 (I.G.) grants. We thank Dr. P. Kapusta for helpful discussions and comments on the manuscript.
References
- 1.Kolber ZS, Barkley MD. Anal Biochem. 1996;152:6. doi: 10.1016/0003-2697(86)90111-9. [DOI] [PubMed] [Google Scholar]
- 2.Lakowicz JR. Color Effect in Detectors in Principles of Fluorescence Spectroscopy. 3. Springer; New York: 2006. p. 119. [Google Scholar]
- 3.Vecer J, Kowalczyk AA, Davenport L, Dale RE. Rev Sci Instrum. 1993;64:3413. [Google Scholar]
- 4.Hanley QS, Subramaniam V, Arndt-Jovin DJ, Jovin TM. Cytometry. 2001;43:248. doi: 10.1002/1097-0320(20010401)43:4<248::aid-cyto1057>3.0.co;2-y. [DOI] [PubMed] [Google Scholar]
- 5.Harris JM, Lytle FE. Rev Sci Instrum. 1977;48:1469. [Google Scholar]
- 6.Leenders R, Van Hoek A, van Iersel M, Veeger C, Visser AJ. Eur J Biochem. 1993;218:977. doi: 10.1111/j.1432-1033.1993.tb18456.x. [DOI] [PubMed] [Google Scholar]
- 7.Luchowski R, Gryczynski Z, Sarkar P, Borejdo J, Szabelski M, Kapusta P, Gryczynski I. Rev Sci Instrum. 2009;80:6. doi: 10.1063/1.3095677. [DOI] [PubMed] [Google Scholar]
- 8.Szabelski M, Iliev D, Sarkar P, Luchowski R, Gryczynski Z, Kapusta P, Erdmann R, Gryczynski I. Appl Spectrosc. 2009;63:363. doi: 10.1366/000370209787598979. [DOI] [PubMed] [Google Scholar]
- 9.Szabelski M, Luchowski R, Gryczynski Z, Kapusta P, Ortman U, Gryczynski I. Chem Phys Lett. 2009;471:153. [Google Scholar]
- 10.Baker GA, Pandey S, Bright FV. Anal Chem. 2000;72:5748. doi: 10.1021/ac0004761. [DOI] [PubMed] [Google Scholar]
- 11.Soini E, Meltola NJ, Soini AE, Soukka J, Soini JT, Hanninen PE. Biochem Soc Trans. 2000;28:70. doi: 10.1042/bst0280070. [DOI] [PubMed] [Google Scholar]
- 12.Bukowski EJ, Bright FV. Appl Spectrosc. 2004;58:1101. doi: 10.1366/0003702041959442. [DOI] [PubMed] [Google Scholar]
- 13.Habenicht A, Hjelm J, Mukhtar E, Bergstrom F, Johansson LBA. Chem Phys Lett. 2002;354:367. [Google Scholar]
- 14.Kim CH, Joo T. Opt Exp. 2008;16:20742. doi: 10.1364/oe.16.020742. [DOI] [PubMed] [Google Scholar]
- 15.Mukhtar E, Bergstrom F, Johansson LBA. J Fluoresc. 2002;12:481. [Google Scholar]
- 16.Wilms CD, Eilers J. J Microsc-Oxf. 2007;225:209. doi: 10.1111/j.1365-2818.2007.01746.x. [DOI] [PubMed] [Google Scholar]
- 17.Wahl M, Rahn HJ, Gregor I, Erdmann R, Enderlein J. Rev Sci Instrum. 2007;78:033106. doi: 10.1063/1.2715948. [DOI] [PubMed] [Google Scholar]
- 18.Masters BR, So PTC. Handbook of Biomedical Nonlinear Optical Microscopy. Oxford; New York: 2008. p. 320. [Google Scholar]
- 19.Lombard J, Lepretre JC, Chauvin J, Collomb MN, Deronzier A. Dalton Trans. 2008;5:658. doi: 10.1039/b710640h. [DOI] [PubMed] [Google Scholar]


