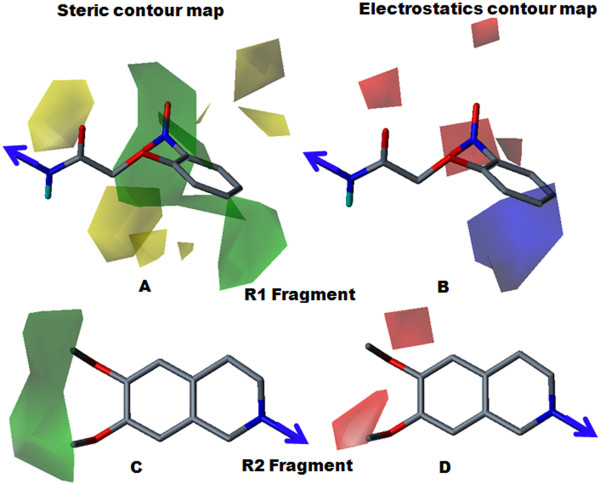
Figure 4.
Steric and electrostatics stdev* coefficient contour map for compound 28 by Topomer CoMFA analysis. (A) Steric contour map for the R1 fragment. (B) Electrostatic contour map for the R1 fragment. (C) Steric contour map for the R2 fragment. (D) Electrostatics contour map for the R2 fragment. Sterically favoured/unfavoured areas are shown in green/yellow contour, while the blue/red polyhedra depict the favourable sites for the positively/negatively charged groups.

