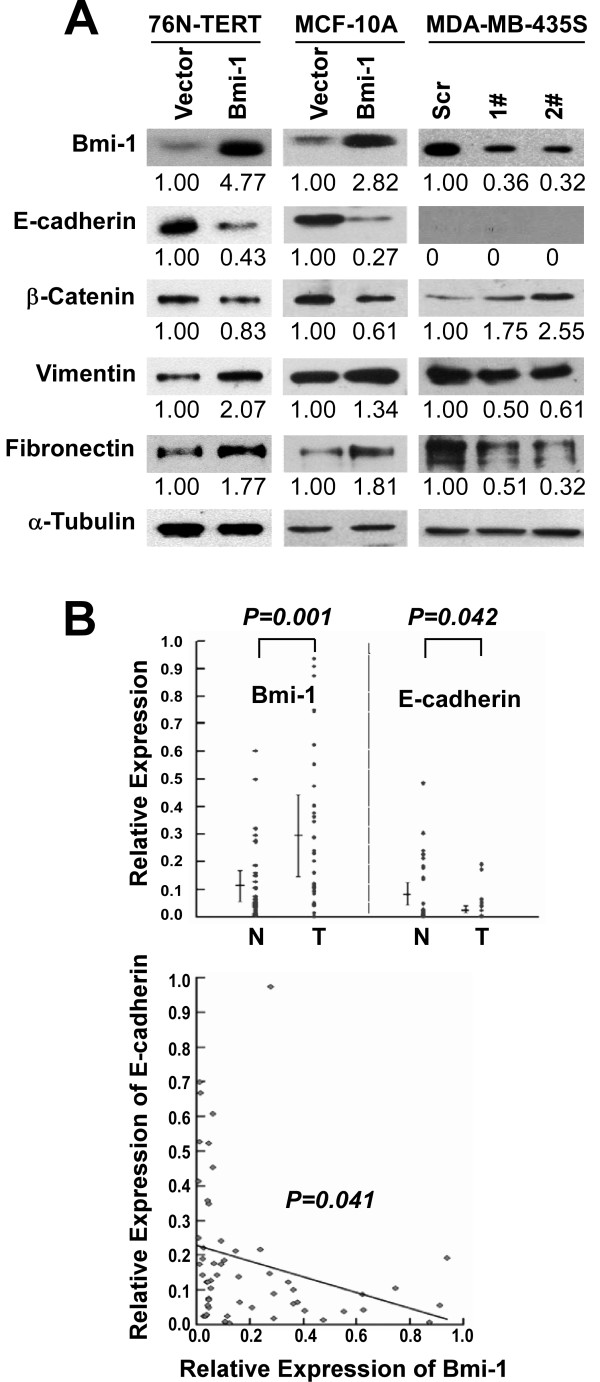
Figure 7.
Bmi-1 regulates EMT markers. (A) The expression of the indicated proteins was analyzed by immunoblotting. Anti-α-Tubulin was the loading control. (B) Top: The mRNA of Bmi-1 and E-cadherin were compared between the breast cancer tissues and the adjacent non-cancer tissues (**P = 0.001, *P = 0.042). Bottom: The converse relationship between Bmi-1 and E-cadherin was plotted (Spearman's rho = -0.418,*P = 0.041).

