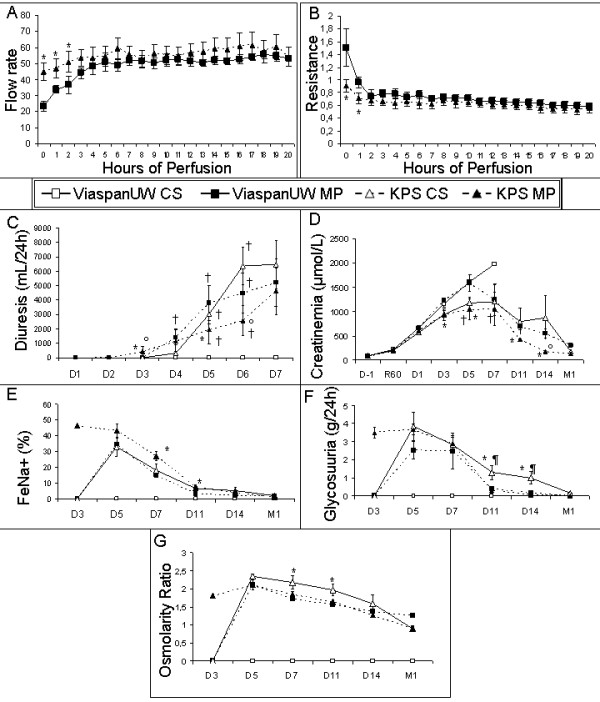
Figure 1.

Perfusion Parameters and Kidney function following reperfusion. A: Flow rate and B: Resistance of machine perfused kidneys. C: Diuresis before and after transplantation. D: Serum creatinine before and after transplantation. E: Sodium excretion fraction. F: Glycosuria. G: Osmolarity ratio between blood and urine. Shown are mean ± SEM, statistics: † : p < 0.05 to ViaspanUW CS; * : p < 0.05 to ViaspanUW MP; ° : p < 0.05 to KPS CS; ¶ : p < 0.05 to KPS-MP.
