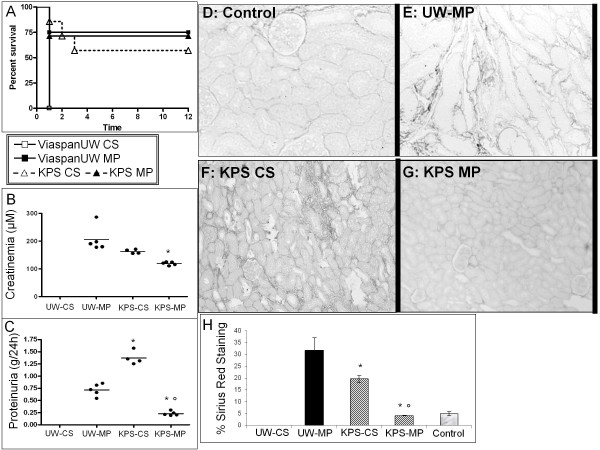
Figure 6.
3 month Outcome. Survival was measured and represented by a Kaplan-Meier plot (A). Function was determined: Creatinemia (B) and proteinuria (C) Representative images of Sirius Red staining of sections obtained from Control (D), ViaspanUW-MP (E), KPS-CS (F) KPS-MP (G) kidneys. Original magnification x100. H: Quantification of fibrosis in kidneys from each group studied. Shown are mean ± SEM, statistics: † : p < 0.05 to ViaspanUW CS; * : p < 0.05 to ViaspanUW MP; ° : p < 0.05 to KPS CS; ¶ : p < 0.05 to KPS-MP.

