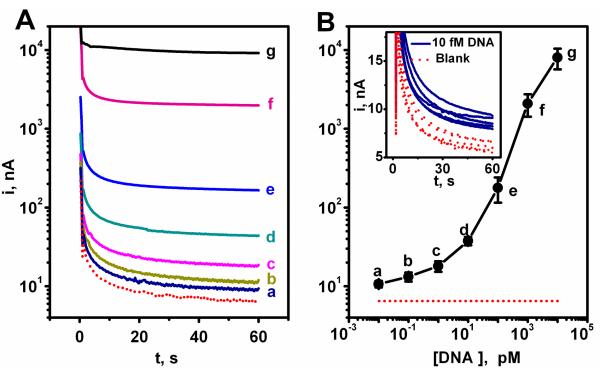
Figure 5.
(A) Chronoamperometric response for different concentrations of the target EC DNA: (dotted red line) 0, (a) 10 fM, (b) 100 fM, (c) 1 pM, (d) 10 pM, (e) 100 pM, (f) 1 nM, and (g) 10 nM. Potential step to −0.2 V. (B) Logarithmic plot of current vs. target EC DNA concentration. Error bars estimated from five parallel experiments. Inset: 5 chronoamperometric signals for 10 fM target EC DNA along with the corresponding blank (0 target EC DNA) signals. Differences between samples containing the 10 fM target EC DNA and the negative control (without target EC DNA) were significant (P < 0.05). Chips modified with the EC SHCP/DTT + MCH monolayer.

