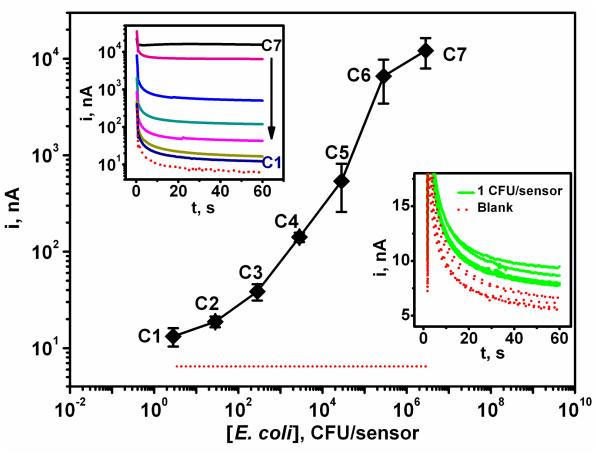
Figure 6.
Calibration plot for E. coli 16S rRNA corresponding to different pathogen bacteria concentrations: (dotted red line) 0, (C1) 3, (C2) 30, (C3) 300, (C4) 3×10³, (C5) 3×10⁴, (C6) 3×10⁵ and (C7) 3×10⁶ CFU per sensor. Inset (top left): corresponding chronoamperograms; inset (bottom right): response for 16S rRNA of 1 CFU/sensors along with the corresponding blank (0 CFU) signals. Differences between samples containing 1 CFU and the negative control (without target DNA) were significant (P < 0.05). Error bars estimated from five parallel experiments. Chips modified with the EC SHCP/DTT + MCH monolayer.

