Figure 3.

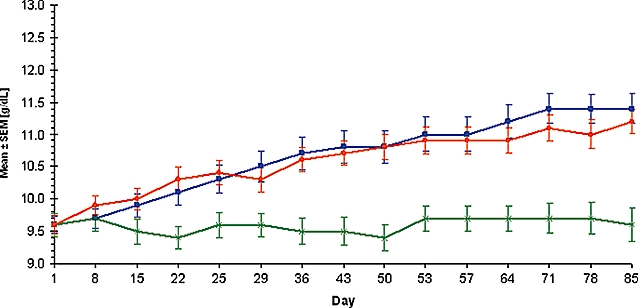
Time course of mean (±SEM) haemoglobin values. Time course of mean (±SEM) haemoglobin values for the full analysis set. Epoetin theta (orange), Epoetin beta (blue) and placebo (green).

Time course of mean (±SEM) haemoglobin values. Time course of mean (±SEM) haemoglobin values for the full analysis set. Epoetin theta (orange), Epoetin beta (blue) and placebo (green).