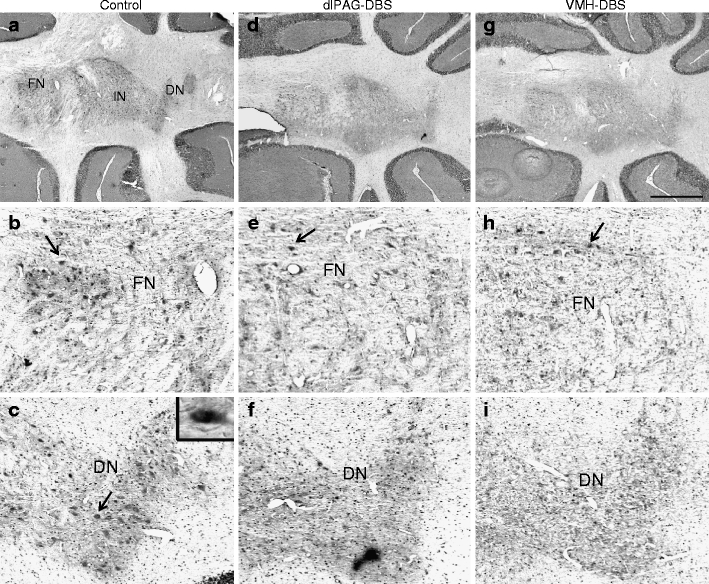
Fig. 3.

Representative low-power photomicrographs of c-Fos expression in a 10-μm-thick horizontal section of the deep cerebellar nuclei at Bregma level −6.10 mm (according to the stereotactic rat brain atlas of Paxinos and Watson of 1998) in a sham rat (a–c), a rat stimulated in the dlPAG (d–f), and a rat stimulated in the VMH (g–i). Panels a, d, and g were taken at ×2 magnification, and b, c, e, f, h, and i were taken at high-power magnification. The arrows point to a c-Fos-ir cell, represented by a small dark dot. The inset in c shows a representative high-power photomicrograph of a c-Fos-ir cell. Scale bar for ×2 magnification power = 1 mm. dlPAG dorsolateral periaqueductal grey, VMH ventromedial hypothalamus, DBS deep brain stimulation, DN dentate nucleus of the cerebellum, FN fastigial nucleus of the cerebellum
