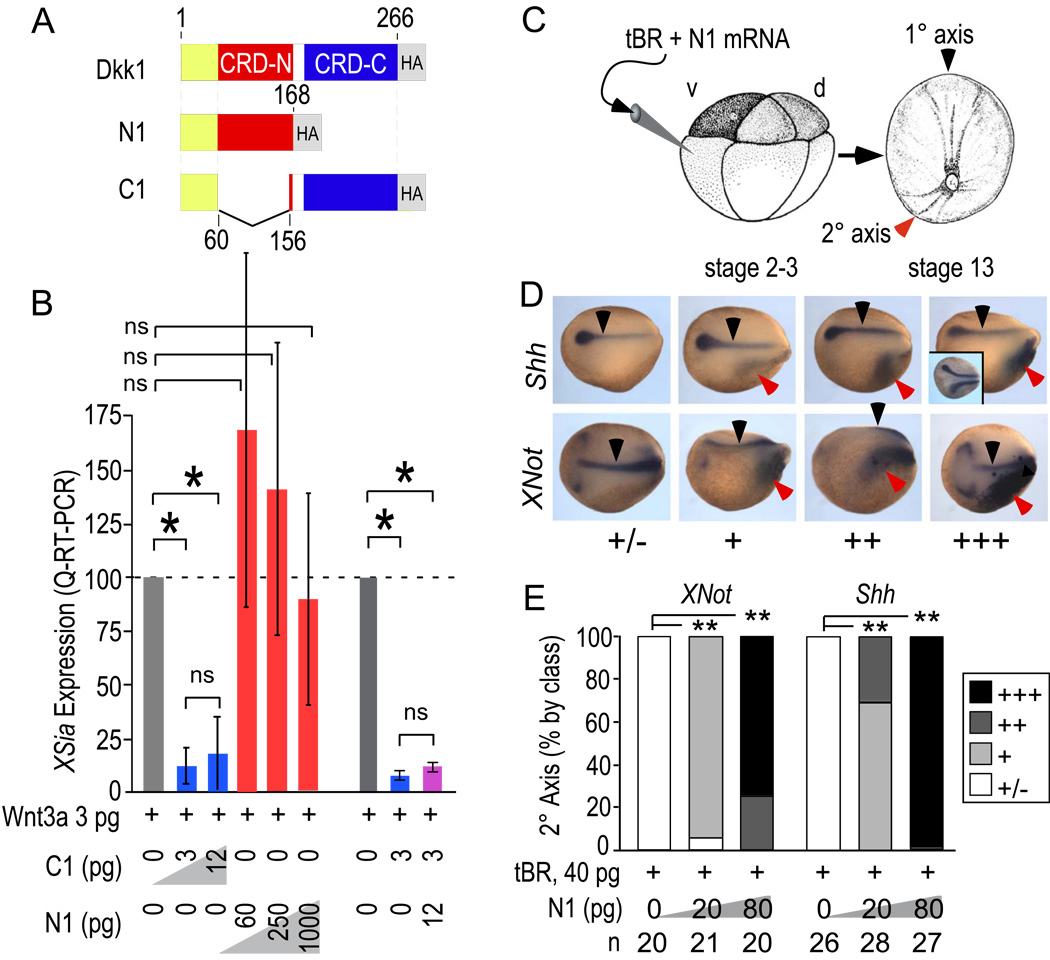
Figure 1. N1 lacks Wnt inhibitory activity but is active in secondary body axis induction.
A) Fragments of Dkk1 expressed by microinjection in this study (see Methods).
B) Xsia induction by Wnt8 in animal cap tissue following injection of N1 and C1 assayed by quantitative real time RT-PCR. N1 has <10−3-fold inhibitory activity relative to C1. Similar results were obtained for Wnt3a (activity <10−2-fold relative to C1). Error bars indicate standard deviation (SD) and p values were calculated by Students T-test [*, <0.01; ns, not significant (>0.05)].
C) mRNAs were injected into the prospective VMZ region and embryos isolated at the neurula stage (stages 14–15).
D) In situ hybridization to Shh and XNot to visualize prechordal (Shh) and chordal (Shh and XNot) mesoderm in the primary (black arrows) and secondary body axes (red arrows) induced by N1 in conjunction with tBR. Class of secondary axes observed is indicated by: +/−, no or faint secondary axis; +, stronger staining but minimal anteriorwards extension; ++, strong staining, modest anteriorwards extension, and +++, robust staining and extensive anteriorwards extension. Note that secondary axis Shh and XNot staining was broader and appeared disorganized compared to the typically narrow pattern of the primary axis. For comparison, the inset shows an embryo with a secondary axis induced by Dkk1 plus tBR.
E) Quantification of the percentage of secondary axes induced according to class. p-values calculated by Chi-square test (**, <0.001). Representative of 2 trials with similar outcomes.

