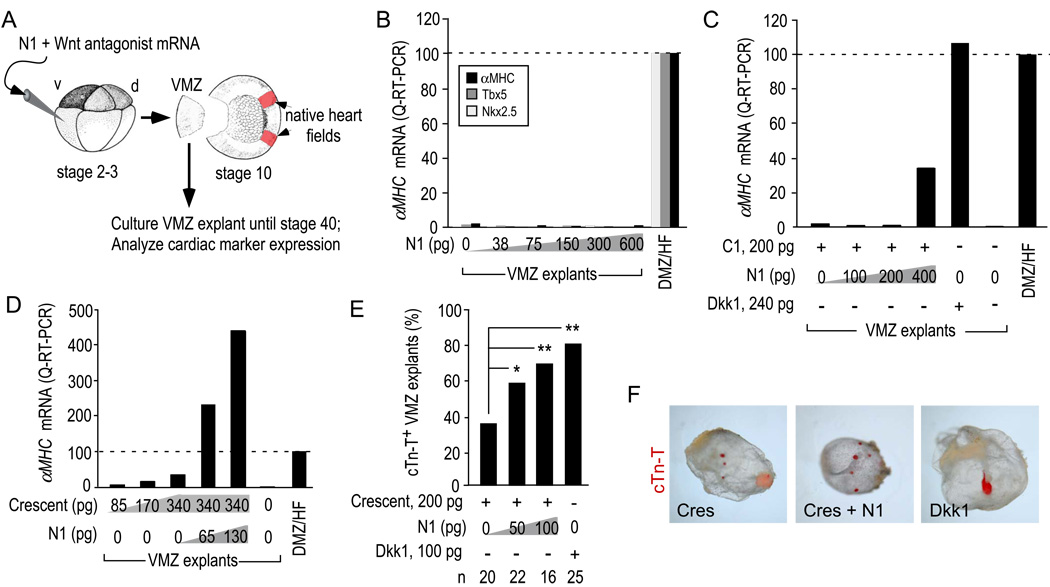
Figure 5. N1 synergizes with Wnt antagonists directly to induce heart tissue.
A) Diagram of the VMZ explant assay. Isolated explants were cultured until stage 28 for analysis of Nkx2.5 and Tbx5 or stage 34 for αMHC expression by quantitative RT-PCR (B–D) or stage 40 for incidence of cTn-T+ explants by immunostaining (E,F).
B) N1 alone did not induce Nkx2.5, Tbx5 or αMHC through a dose range of 38–600 pg of injected mRNA, whereas the native heart field (HF) in DMZ explants expressed each marker as expected.
C,D) The effect of N1 plus a constant amount of C1 (C) or Crescent (D) on αMHC induction. The experiments are representative examples of at least 3 trials.
E) Incidence of VMZ explants with ectopic cTn-T+ myocardial tissue. p-values were calculated by the Chi-square test [**, <0.001; *, <0.05].
F) Whole mount view of stage 40 VMZ explants immunostained with anti-cTn-T showing that although N1 increased the incidence of cTn-T+ explants, they retained the small, dispersed foci characteristic of Crescent-induced myocardial tissue. Fluorescent image (red) is superimposed on brightfield image of explant.

