
Figure 1.
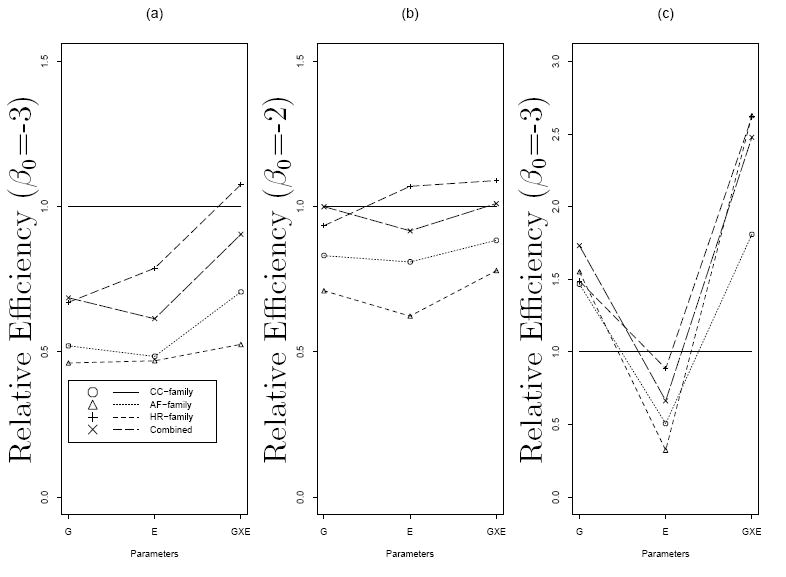
Relative efficiencies of different study designs by baseline log odds β0 and allele frequency p. Panel (a): p = 0.1 and logit(Pr(D = 1∣G,E)) = −3 + log(1.5)G + log(2)E + log(3)G × E; Panel (b): p = 0.1 and logit(Pr(D = 1∣G,E)) = −2 + log(1.5)G + log(2)E + log(3)G × E; Panel (c): p = 0.01 and logit(Pr(D = 1∣G,E)) = −3 + log(15)G + log(2)E + log(10)G × E. The solid horizontal lines represent the relative efficiency for population based case-control studies.