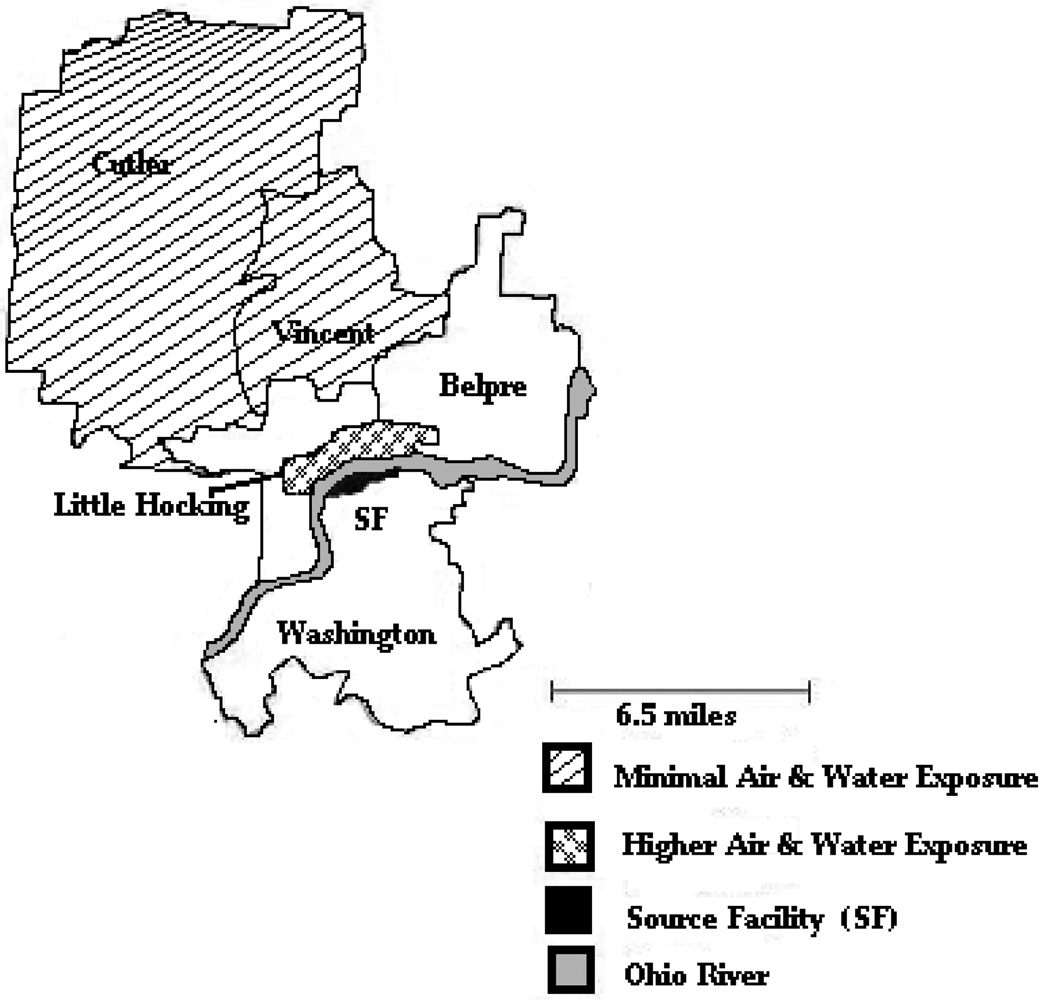
Figure 1. Map showing the locations of the studied communities and the source facility.
Subjects for the minimal air exposure group were selected from the area shown in yellow, subjects for the higher air exposure group from the area shown in red. Residents in both of these areas obtained their water from the same public residential water supply. The location of the source facility is shown in black. The residents lived in Ohio, the source facility is located in West Virginia. The state boundary, the Ohio River, is shown in blue.

