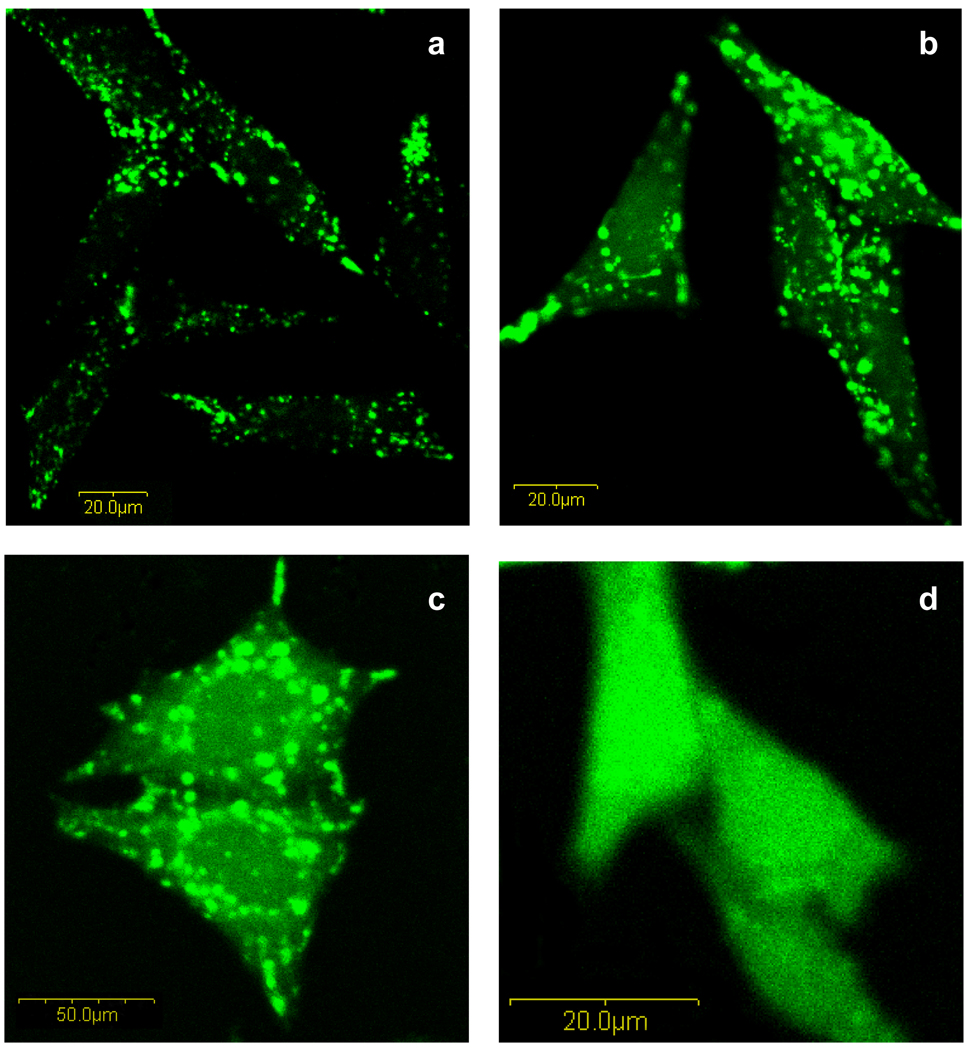
Figure 10.
Confocal microscopy images of HeLa cells showing the subcellular distribution of calcein fluorescence. The cells were treated with (a) 2.0 mg mL−1 calcein, (b) both 2.0 mg mL−1 calcein and 1.0 mg mL−1 poly(l-lysine iso-phthalamide), (c) both 2.0 mg mL−1 calcein and 0.025 mg mL−1 PP-75, and (d) both 2.0 mg mL−1 calcein and 0.1 mg mL−1 PP-75. Images were acquired with an Olympus FluoView™ FV300 confocal unit (×60 magnification) at 3.5 h after 30 min of uptake.

