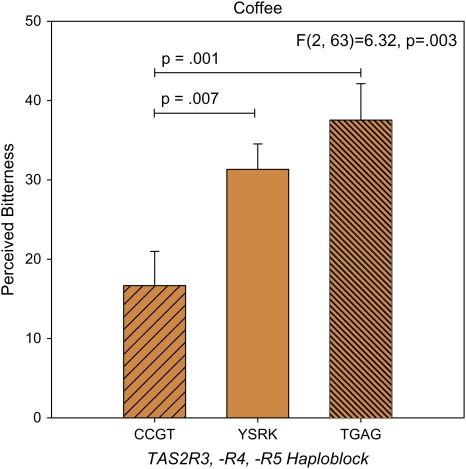
Figure 3.
Bitterness intensity ratings of espresso coffee, collected using the gLMS, a psychophysical scale with ratio properties (i.e., a 40 is twice as great as a 20). Effects of the TAS2R3/R4/R5 haploblock were assessed via ANOVA. Genotypes are CCGT = CC,CC,GG,TT; YSRK = C or T, C or G, A or G, G or T; TGAG = TT, GG, AA, GG. Data represent means ± standard errors. Pairwise comparisons between groups (Fisher least significant difference) are indicated with horizontal lines. This figure appears in color in the online version of Chemical Senses.

