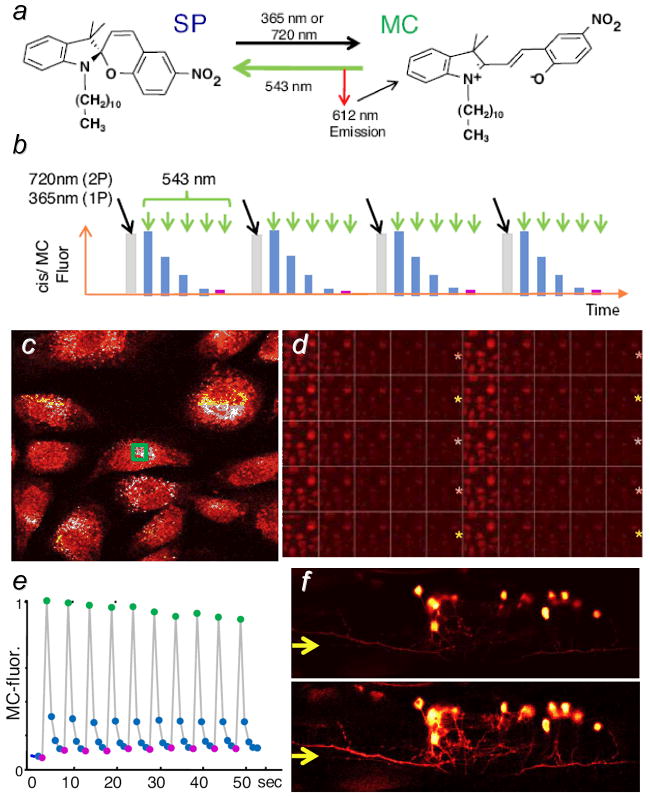
Figure 8.

Optical lock-in detection (OLID) of photoswitchable fluorescence probes, using cross-correlation analysis.[92] a) Dark and active optical states of nitroBIPS, corresponding to its spiropyran (SP) and merocyanin (MC) forms; b) optical modulation cycle using two input wavelengths; c) nitroBIPS-labeled fibroblasts at the peak of their fluorescence; d) partial frame sequence showing changes in fluorescence intensity, subject to the modulation cycle in b); e) internal reference waveform, based on the normalized fluorescence intensity within the green region of image c); f) unmodulated fluorescence image (upper) versus correlation image (lower) of cytoplasmic Dronpa in the neurons of a live zebrafish larva. Published with permission from the author.
