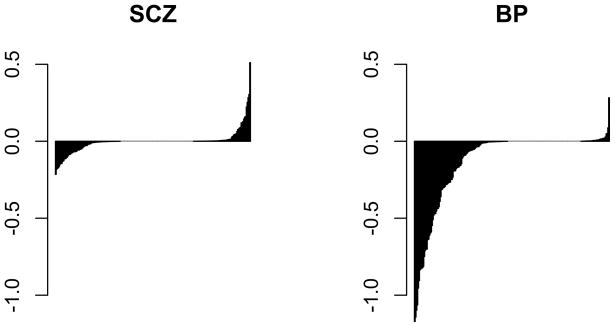
Figure 2. Separately sorted effect sizes for diagnostic classes.
Expression levels were standardized such that transitioning from normal to the indicated affected category shifts miRNA expression by units of standard deviation on the Y-axis. Bolder negative effects for the bipolar group are evident.

