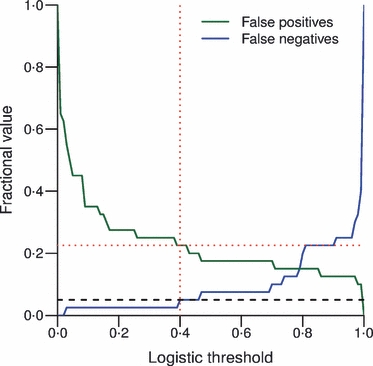
Fig. 6.

False negative and false positive error rates from the occupancy model for all threshold values. The black dashed line indicates a 5% false negative error rate and the red lines indicate the resulting threshold between suitable and unsuitable habitat and the corresponding false positive error rate for that threshold.
