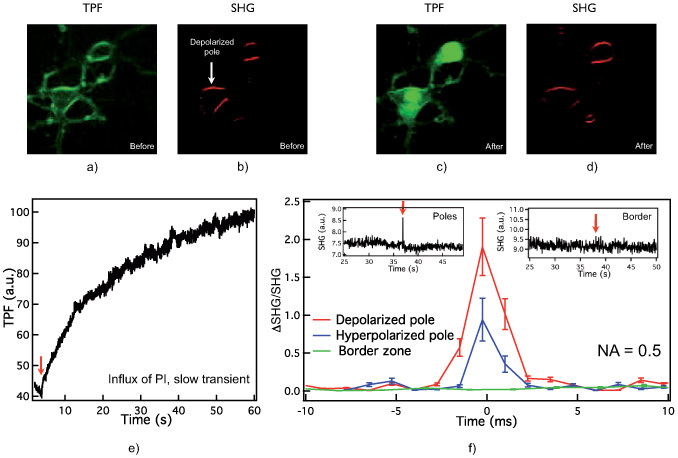
Fig. 3.

Images of hippocampal neurons labeled with SynaptoredTM C2, (a) backward TPF before electroporation, (b) forward SHG before electroporation showing localization of the depolarized (cathodic) pole; (c) backward TPF after electroporation of the same cells, (d) forward SHG after electroporation (same cells). (e) TPF signal after electroporation at the hyperpolarized pole. (f) Averaged SHG normalized to SHG when no pores are present, at depolarized (red trace), hyperpolarized (blue) poles, and border region (green), collected with NA = 0.5 condenser.
