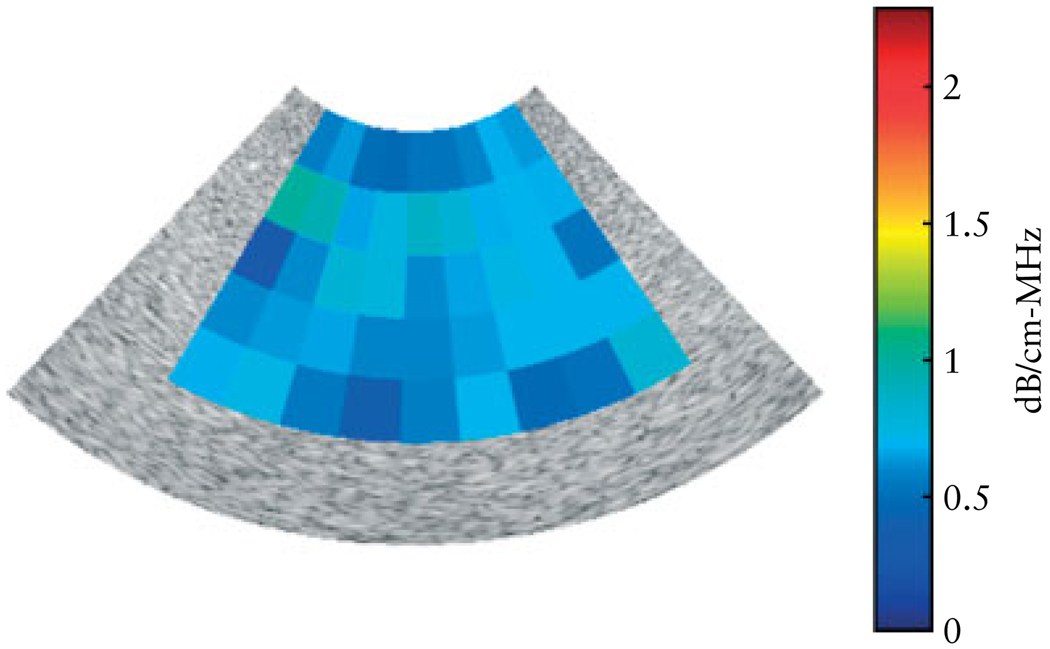
Figure 2.
Attenuation map for a B-mode image obtained from the tissue-mimicking phantom (the phantom has a known attenuation coefficient of 0.64 dB/cm-MHz) using a 4–9-MHz endovaginal transducer (z.one; Zonare Medical Systems, Inc.). Each pixel represents a mean attenuation coefficient value for a region of interest. The mean (± SD) attenuation coefficient measured for the phantom was 0.64 (± 0.13) dB/cm-MHz.

