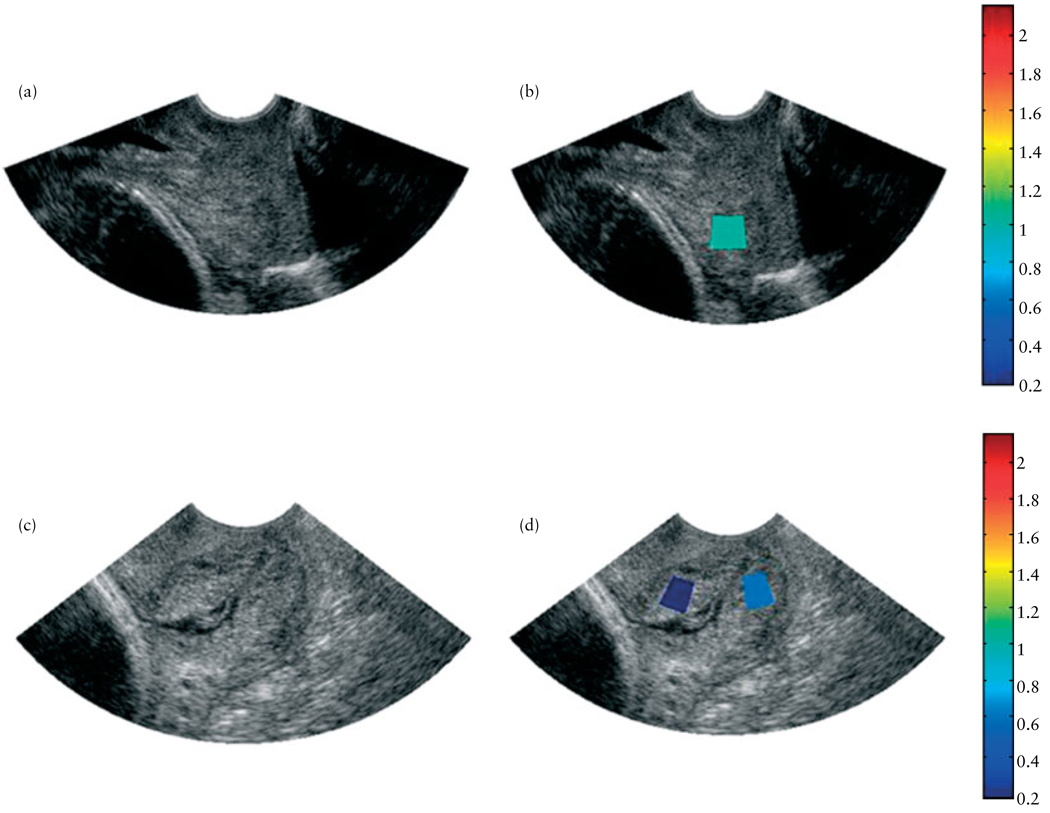
Figure 4.
Ultrasound B-mode images (a,c) and B-mode images superimposed with maps of the mean attenuation estimates (b,d) of two women in the study, one at 14 weeks of gestation, with cervical length 31 mm (a,b) and the other at 38 weeks of gestation, with cervical length 35 mm (c,d). The colors of the regions of interest represent a mean attenuation (dB/cm-MHz) consistent with the corresponding scale bar.

