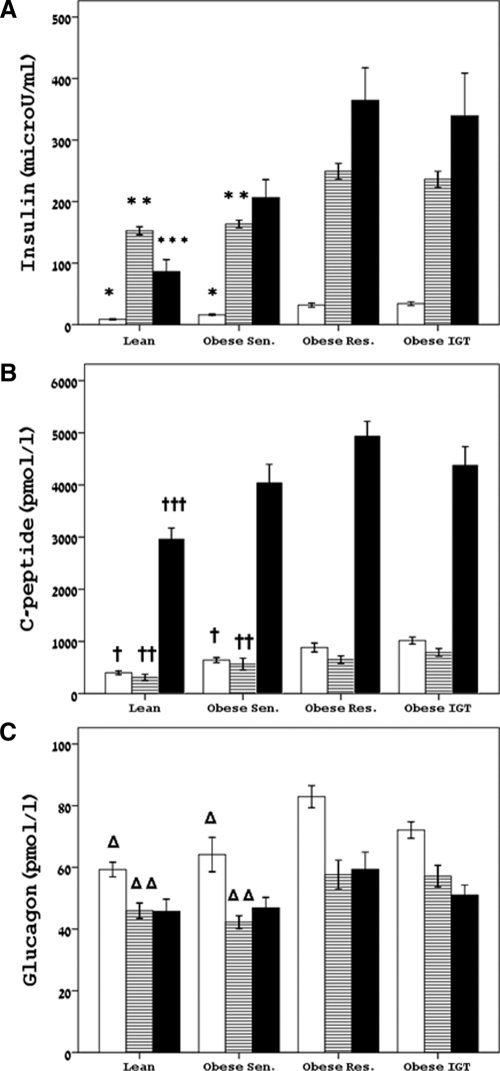
Figure 1.
Concentrations of fasting and steady state-levels of insulin (A), c-peptide (B), and glucagon (C) during fasting, euglycemic hyperinsulinemia, and hyperglycemic hyperinsulinemia. White bars, fasting state; dashed bars, SS euglycemic-hyperinsulinemic clamp; black bars, SS hyperglycemic clamp. *, P < 0.001 for lean vs. obese resistant (Res.) and IGT, respectively, P < 0.001 and P = 0.002 for obese sensitive (Sen.) vs. obese resistant and IGT. **, P < 0.001 for lean vs. obese resistant and IGT, respectively, P < 0.001 and P = 0.001 for obese sensitive vs. obese resistant and IGT. ***, P = 0.01 for lean vs. obese resistant and IGT, respectively; †, <0.001 for lean vs. obese resistant and IGT, respectively, P = 0.001 for obese sensitive vs. IGT; ††, P < 0.001 for lean vs. all others, P = 0.04 for obese sensitive vs. obese resistant and obese IGT; †††, P = 0.001 and P = 0.02 for lean vs. obese resistant and IGT, respectively; Δ, P < 0.001 for lean vs. obese resistant and P = 0.002 vs. IGT, P = 0.002 and P = 0.04 for obese sensitive vs. obese resistant and IGT, respectively; Δ Δ, P = 0.03 and P = 0.02 for lean vs. obese resistant and IGT, respectively, P = 0.007 and P = 0.02 for obese sensitive vs. obese resistant and IGT.

