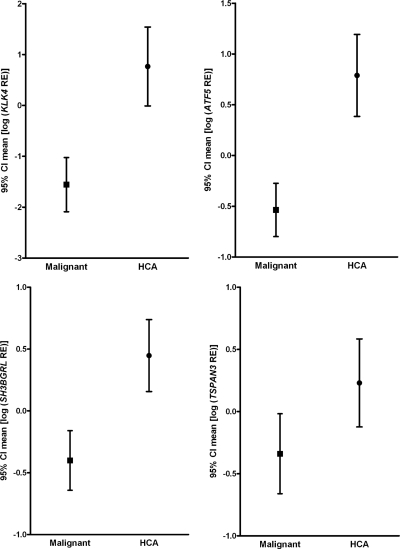
Figure 3.
Graphs showing results of qPCR for ATF5, KLK4, SH3BGRL, and TSPAN3 transcripts evaluated in the HCA vs. malignant groups. The results are expressed as mean of log transformed RE values [95% confidence interval (CI)]. All transcripts are expressed in HCA while their expression is reduced (or absent) in most of malignant tumors. Specificity and sensitivity are detailed in Table 2.

