Figure 9.

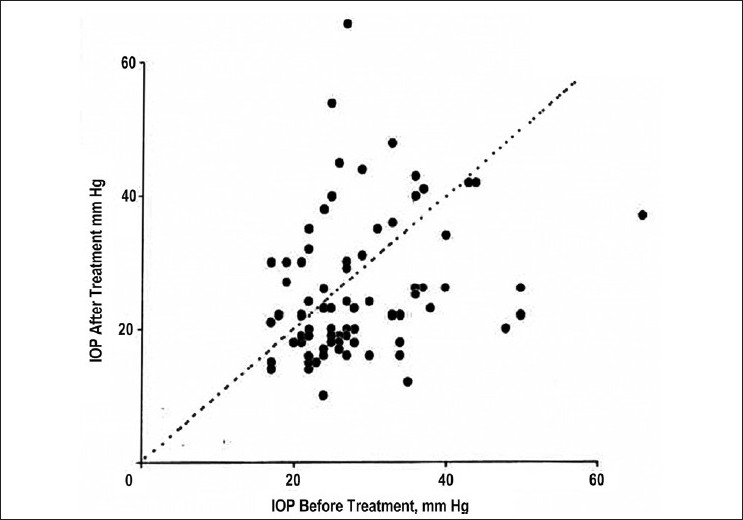
Scatter plot of intraocular pressure (IOP) before and after TSCPC (trans-scleral cyclophotocoagulation). The points above the neutral line indicate that 32.9% (26/79) eyes had higher IOP after therapy compared to before therapy[20]

Scatter plot of intraocular pressure (IOP) before and after TSCPC (trans-scleral cyclophotocoagulation). The points above the neutral line indicate that 32.9% (26/79) eyes had higher IOP after therapy compared to before therapy[20]